Deephaven 101
Getting Started with Deephaven on the Web
Open your web browser using the link provided to you.
Once the site loads, enter the Username and Password you’ve been provided and click Login.
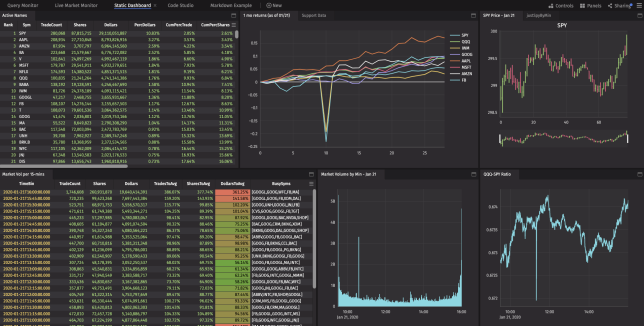
After logging in, you'll be taken to a sample dashboard.
Note: The following content is intended to provide you with a quick start to using Deephaven on the web. However, extensive documentation is also available in the Getting Started section of our full documentation.
Working with Dashboards
Dashboards are customized collections of content including tables, plots and/or sets of nested panels. You can manipulate tables and plots in dashboards by dragging and dropping, as you’d expect. Using, creating, and sharing dashboards is fundamental to the value of the experience.
Open an Existing Dashboard
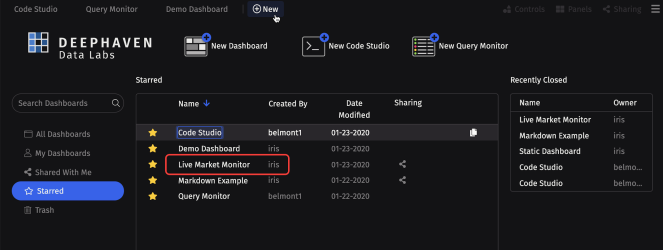
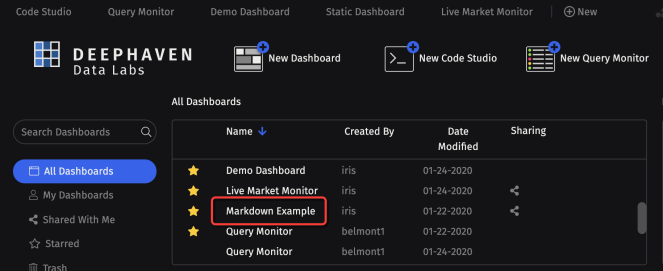
To open an existing Dashboard, click the +New button at the top of the Deephaven interface.

That will open the All Dashboards window as shown below. Click on “Live Market Monitor” to open a second dashboard. (Note: This is an actual table of live, ticking data, so it will only populate on trading days after 9:45 ET.)
Create a New Dashboard
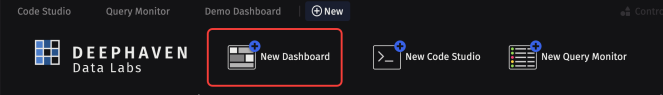
To create a new dashboard, click the +New button at the top of the Deephaven interface, and then select New Dashboard.
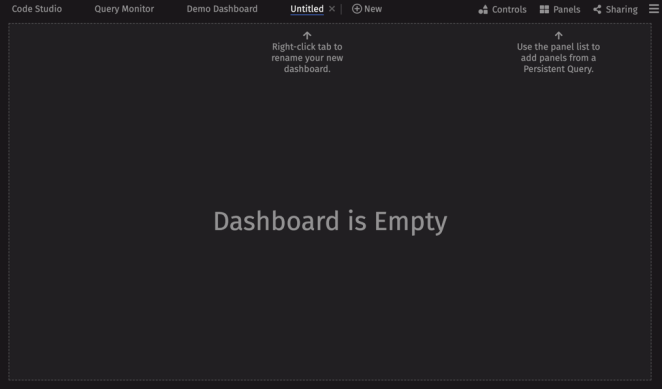
Selecting New Dashboard will open an empty dashboard window called Untitled.
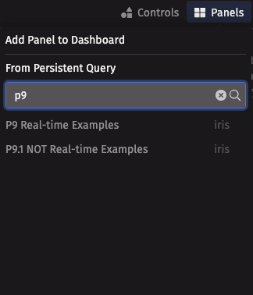
When you first click Panels, a list of “Persistent Queries” will be presented as shown below. Persistent Queries are essentially applications and analytics running on the platform. These queries generate tables and/or plots that you can add to your dashboard(s) or consume via APIs. To see the list of tables or plots associated with a Persistent Query, click the name of the query in the Panels list. You can also use the search field to filter your options. For example, when "p9" is typed in the search field, two queries are presented, as shown below.
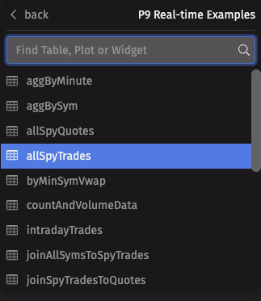
When the query named "P9 Real-time Example" is selected, the tables and plots generated by that query will be presented in a list. Simply select the name of the table or plot from the list to add it to your dashboard layout. In this case, we'll select the allSpyTrades table.
The table will then be added to the dashboard.
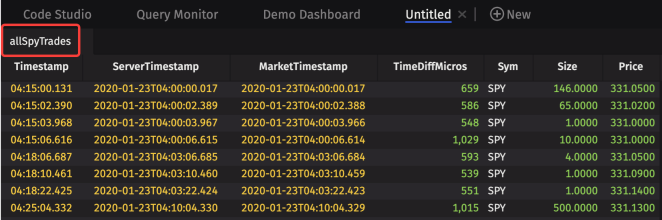
You can repeat this workflow to add as many tables and plots to the dashboard as you'd like, including those from different Persistent Queries (i.e., not just the one called “P9 Real-time Examples”).
Note: The Persistent Query called "LearnDeephaven" is available to all users on any installation.
At any time, you can right-click on the Dashboard tab and rename it.
When you close a Dashboard, it can easily be launched again by selecting the +New tab. Closed Dashboards can be found in the “All Dashboards” or “Recently Closed" sections of that window.
Sharing Dashboards
Deephaven Dashboards can be shared with colleagues or customers. To share an open dashboard, click the Sharing button in the top navigation bar. 
The list of usernames presented in the Sharing With Others window represents all users with whom you are able to share a dashboard:
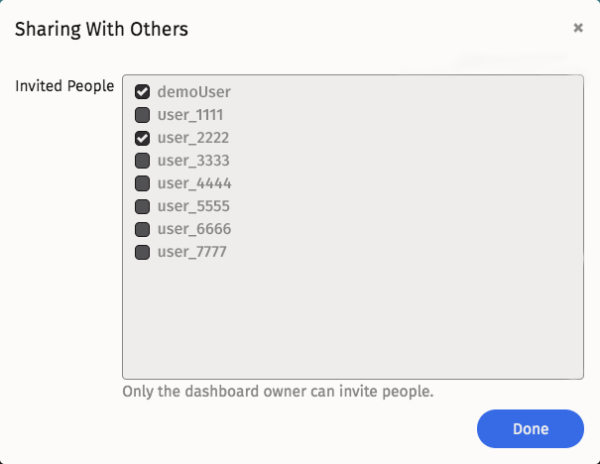
Select the checkbox next to a username to share that dashboard.
The person with whom the Dashboard is shared will see the named dashboard appear in both their “All Dashboards” and “Shared with Me” lists.
The permissions and update-flows between the Owners and the Users of shared dashboards are detailed in the Sharing Dashboards section of the Deephaven documentation.
Launching a Code Studio and Writing Queries
A Code Studio is a workspace for writing queries and code to interrogate and manipulate data. It can serve as an ad hoc console or REPL.
Multiple Code Studios may be open simultaneously, including those using different programming languages. This is especially beneficial if you have a variety of independent, ad hoc analyses or development projects underway at the same time.
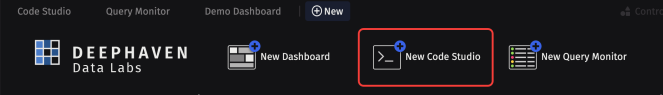
To launch a new Code Studio, click +New, then select the New Code Studio button.
Like Dashboards, Code Studios can be renamed and closed by right-clicking the title tab.
After the Code Studio window opens, choose the query server on which to run this worker, the Heap Size (in GB) needed to provision the pending work, and your preferred scripting language (Groovy or Python).
Note: All of the examples in this document will be scripted in Python.
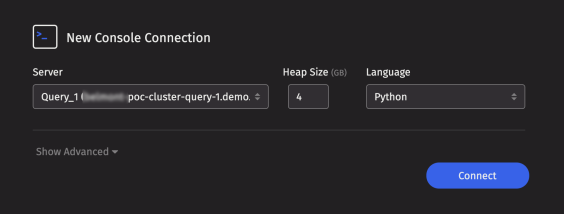
After you make your selections, click Connect.
The Code Studio provides a powerful editor experience for seeing and working with data, by using both the Deephaven table library operations and combining them with Python (or Java).
The tables, plots, and widgets your scripts produce will immediately render at the bottom of the experience. This real-time feedback loop (on all sorts of data) is great for on-the-fly analysis, debugging, and development.
Let's see how the Code Studio works by writing a simple query. Either copy and paste or type the following query immediately after the flashing cursor in the Console section of your new Code Studio, then select the Enter or Return key on your keyboard:
trades = db.i("FeedOS", "EquityTradeL1").where("Date=currentDateNy()")
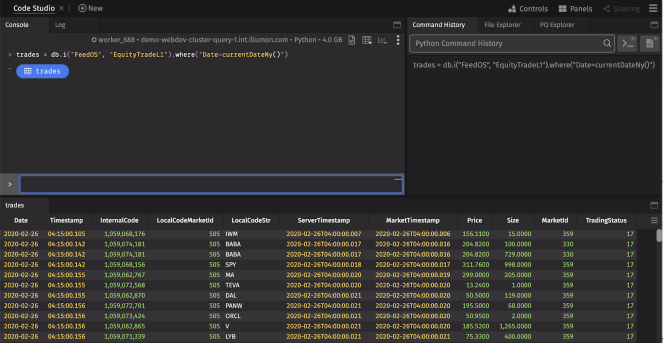
This query accesses a ticking table (EquityTradeL1) from the FeedOS namespace, filtered to the current day, and creates a new (updating) table. We call it “trades" in this example, but you could choose any name.
The specifics about writing queries are covered in the Writing Queries section of our full documentation. Because new users like examples they can easily follow, we've also included sample queries in the online Example Python Notebooks. Sample queries from the notebooks can be copy/pasted into your Code Studio to help you gain familiarity with the Deephaven query methods. There are also examples and "cheat sheets" throughout our documentation.
The Persistent Queries loaded with Deephaven can also be used to review the query language. To learn more, see the Getting Started with Deephaven Classic section below.
The Log tab (located at the top of the Code Studio near the Console tab) records what your query/code is doing, including data input/output, and processing. This is primarily intended for advanced programmers, but the Log will record errors that may occur to help find and resolve problems when query writing.
For example, you might see a lengthy exception, as shown below:
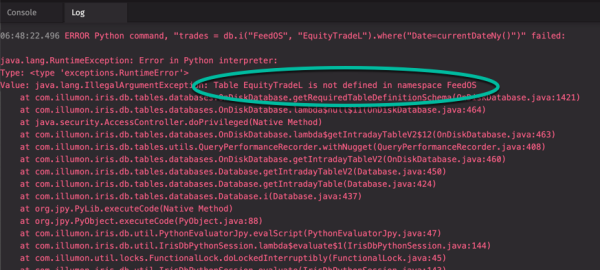
Don't panic! While all this text may be intimidating, what this message is showing you is that the table does not exist in this namespace. On a closer look, you can see a typo in "EquityTradeL1."
If you need more help, please reach out to the Deephaven support team. One option to do this is to right-click within the Log window to send your failed query directly to Deephaven support personnel. For additional options, see the Need Help? Section.
Using Notebooks and the File Explorer in the Code Studio
The Deephaven Notebook is a valuable feature in which users can develop query components, stage draft queries, or simply store notes. Moreover, it can be used as a "sandbox" in which queries can be developed and refined, and then easily executed in Deephaven.
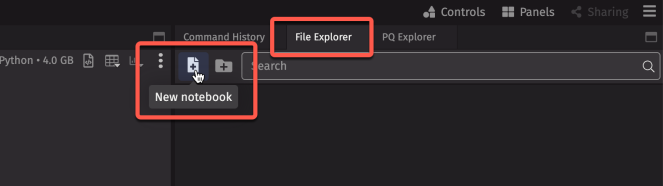
You can open a new Notebook experience by selecting the File Explorer tab at the top right of the Code Studio, then selecting the New notebook button. The File Explorer also allows you to search for and open saved notebooks.
To complement the direct REPL experience, the Notebook can be used to interrogate data or develop apps.
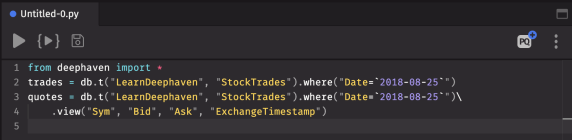
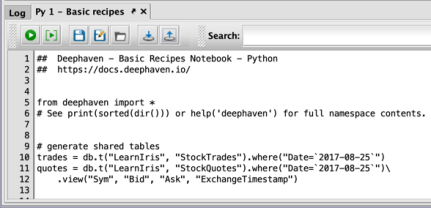
For example, the following screenshot shows a Notebook with three lines of a Python query script (borrowed from the Persistent Query "P1 Basic recipes").
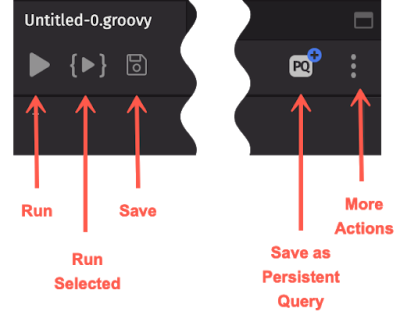
You can run all or just a portion of the script in the Notebook by using the buttons at the top left of the Notebook. To save your work as a persistent query use the PQ button at the top right. The More Actions menu provides options to Copy, Rename, or Delete your file.
Persistent Queries and the Query Monitor
In the previous section, we used tables and plots to create dashboards. Those objects were work products of “Persistent Queries” (i.e., queries and code that run within the Deephaven system).
We have created a few examples of Persistent Queries for your perusal. Reviewing those scripts is an efficient way to get started with Deephaven.
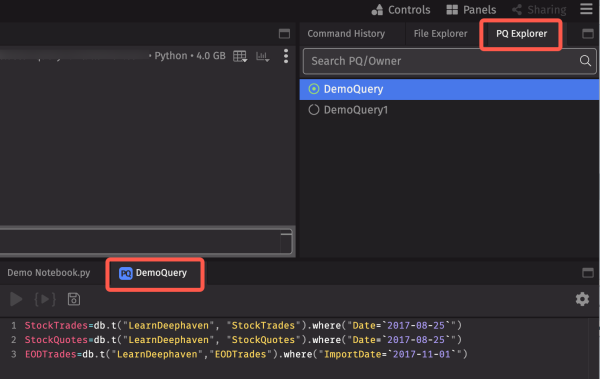
PQ Explorer
The PQ Explorer tab at the right of the Code Studio lists all the persistent queries available to you, as well as some status information. As shown below, the green circle indicates that DemoQuery is active, while DemoQuery1 is not. Selecting any query automatically opens its script in a new notebook panel.
Query Monitor Table
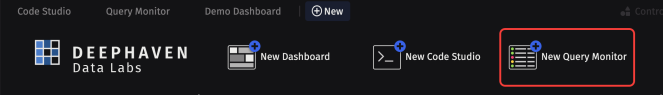
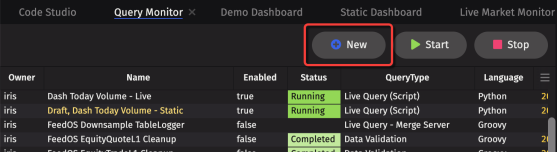
The Query Monitor table contains information about all of the Persistent Queries you are authorized to view in Deephaven. To open a Query Monitor, click the +New button at the top of the Deephaven interface, and then select New Query Monitor.
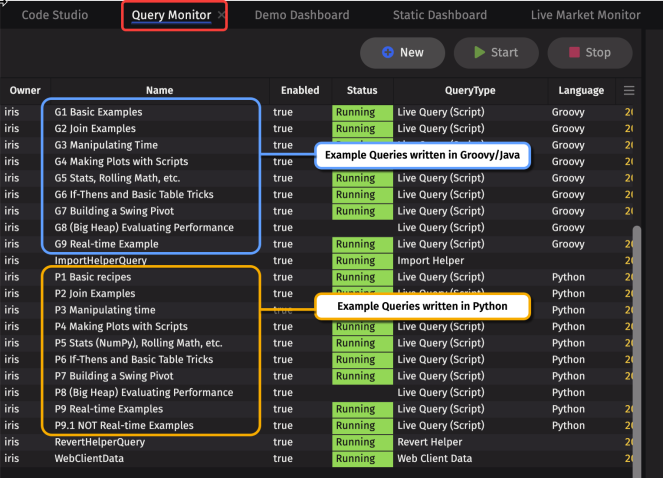
As shown below, the Query Monitor table provides information about each Persistent Query you are authorized to view, including the owner's name, the query name, whether it is enabled, its status and type, etc. The content in the table can be sorted and filtered like any other table.
Query Summary/Configuration
When a query name is selected in the table, the panel on the right side of the Query Monitor will reveal further information about that query. When a query name is selected in the table, the panel on the right side of the Query Monitor will reveal further information about that query. This information is presented in the following five tabs: Summary, Settings, Permissions, Scheduling, and Script.
Note: if you are not authorized to edit the query, only the query summary will be available.
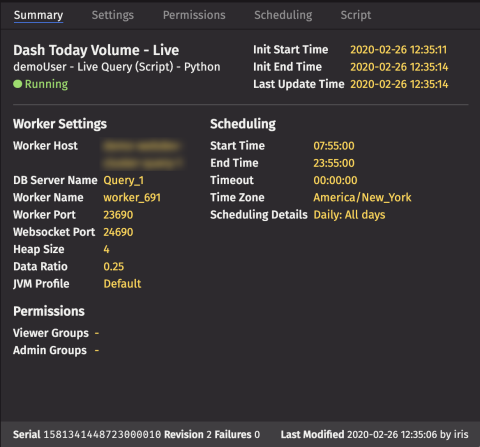
Summary
In the example above, the Summary tab displays details for the query named "Dash Today Volume - Live", such as the query's start and end time, the last time the query was updated or modified, worker settings, scheduling information, and its permissions.
Settings
Selecting the Settings tab opens the Persistent Query Configuration Editor. This displays configuration details about the highlighted query. Users with the appropriate permissions can edit the configuration settings for existing queries in this window. See Creating Persistent Queries for more information.
Permissions
Selecting the Permissions tab opens the Access Control Settings. Users with the appropriate permissions can manage these settings. See Creating Persistent Queries for more information.
Scheduling
Selecting the Scheduling tab opens the scheduling configuration for the highlighted query. Users with the appropriate permissions can edit these options. See Creating Persistent Queries for more information.
Script
Selecting the Script tab opens the Persistent Query Script Editor. This displays the script of the highlighted query and may be edited in this window. See Creating Persistent Queries for more information.
Creating Persistent Queries on the Web
To create a new Persistent Query, select the +New button at the top of the Query Monitor.
This opens a new instance of the Persistent Query Configuration editor.
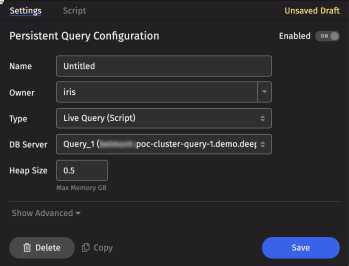
Settings
You can choose between several configuration options when creating a new Persistent Query. The required fields are:
- Name - Query names can be any combination of characters and numbers. However, each query in a given installation of Deephaven must have a unique name.
- Owner - When creating a new query, your username is automatically added as the owner for that query. Note: This field can be edited by superusers only.
- Type - Choose Live Query; additional query options will be available in upcoming releases.
- DB Server - A list of available servers will be presented in this field. For live queries, select any query (rather than a merge) server from the list.
- Memory (Heap) Usage - Estimate the amount of memory required for this query to run (e.g., 8 GB).
Permissions
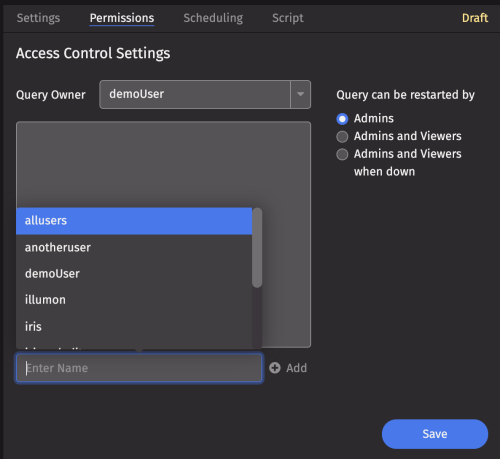
The Permissions tab opens the Access Control Settings, where you can authorize users or user groups to view and/or restart the query. The Enter Name field brings up a searchable list of users, as shown above.
To learn more about permissions, Creating Persistent Queries on the Web> Permissions in the online documentation.
Scheduling
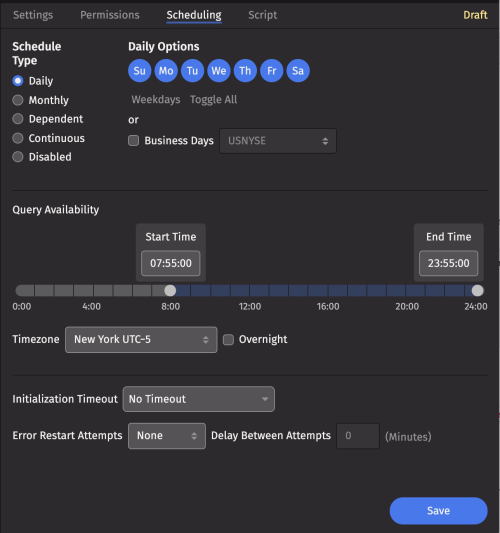
The Scheduling tab provides options to dictate the type of schedule the query should follow, or to disable the query altogether. To adjust the query's availability, simply drag the Start Time and End Time sliders to the preferred time, or select each input directly to enter a specific value.
There are many more options available depending on the query configuration type and Schedule Type. To learn more, see Creating Persistent Queries on the Web> Scheduling in the online documentation.
Script
Selecting the Script tab opens the Persistent Query Script Editor, which allows you to review the script associated with a Persistent Query or, if you have the appropriate permissions, edit an existing script. In the following screenshot, the "P1 Basic recipes" Persistent Query is selected on the left, and the script for that query is presented on the right:
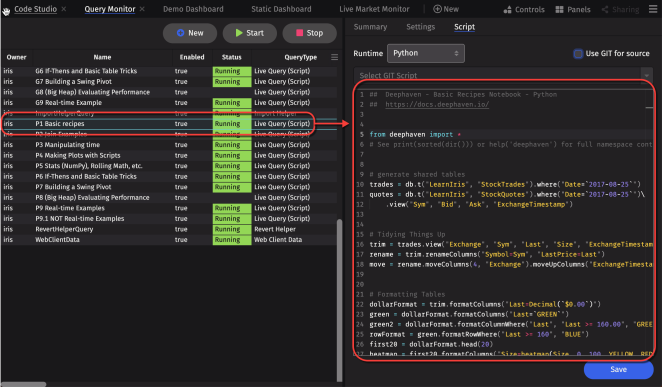
There are, of course, many more options available. For full details, see Query Configuration.
Working With Tables
Though writing scripts is valuable and important, users want to be able to manipulate results directly in the tables they see. There are several ways to manipulate your data. Right-click any column header to open the following context menu:.
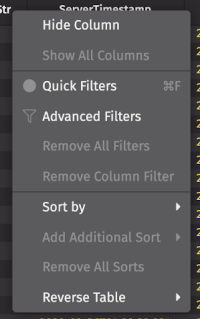
Some basic options are itemized below.
Sort
To sort a column, choose Sort by options from the column header menu, or simply click the column header once to sort in ascending order, a second time to sort in descending order, and a third time to return the column to its original order.
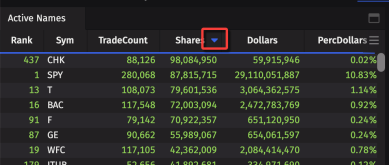
Once a table has been sorted in this fashion, an "up" arrow or "down" arrow will appear to the right of the column name to indicate the sort and the order (as shown below). A blue underline also displays across the bottom of the column header row anytime a table is sorted.
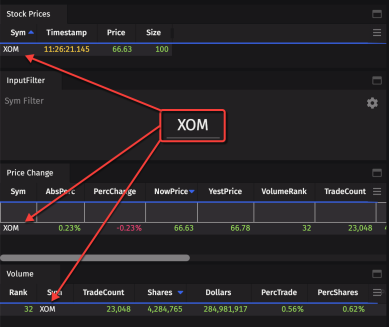
Filter
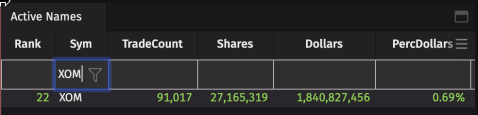
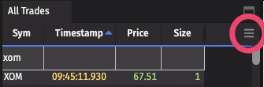
There are several ways to filter your data. Choose Quick Filters from the column header menu to add a filter bar across the header rows of your table. Type in your desired value (e.g., XOM) to immediately apply that filter to the table, as shown below.
In addition to matching exact values, there are other options you can use to filter the data. For example, entering ">=50" in a number field will show table rows containing values greater than or equal to 50. To see all options, please review the Quick Filter Statement Options.
The funnel icon (in the highlight above) opens the Advanced Filters dialog. To learn more, see Advanced Filters.
Plot
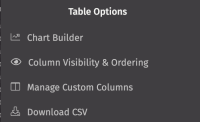
Persistent Queries can be used to create plots from your data. However, you can also create a simple chart directly from the table. In the table containing the data you want to plot, click the Table Options menu.
Then select Chart Builder.
The Chart Builder interface will allow you to choose one of the four available chart types, and configure the applicable axis values, as shown below.
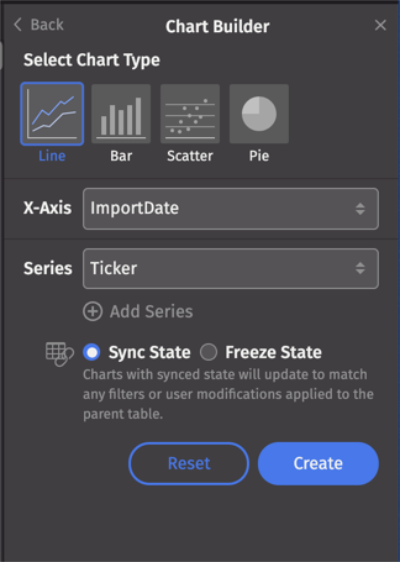
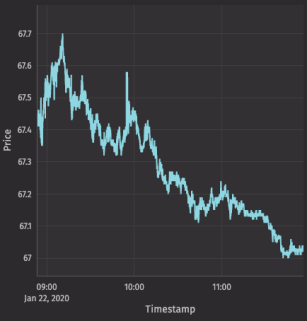
Make your selections (as shown above) and click Create. Note: The resulting plot will reflect any filters applied to the table. The following line chart shows the prices for XOM:
Hide or Reorder Columns
The Column Visibility & Ordering feature allows you to quickly hide/show, rearrange, and sort columns in one place. To access the dialog, click the hamburger icon in the table you'd like to modify to open the Table Options menu, and then select Column Visibility & Ordering. A list of column names will appear. The eye icon indicates which columns are visible in the table.
As shown below, drag and drop any selected column to rearrange the order in which they appear in the table.
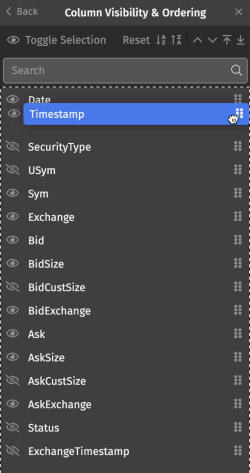
This can also be accomplished using the arrow buttons at the top of the dialog:
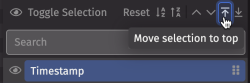
The toolbar includes additional buttons to sort the table in ascending or descending order, and a Reset button to restore the table to its default arrangement.
Manage Custom Columns
Manage Custom Columns is a feature that enables you to quickly add new columns to store custom calculations directly in the Deephaven interface, rather than updating a table's query. (See Custom Columns to learn more.)
To create a custom column, click the hamburger icon in the upper right corner of the table. Then select Table Options, and then Manage Custom Columns.
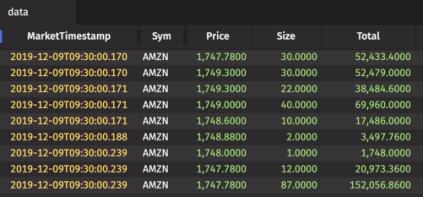
In the Manage Custom Columns dialog (shown below), enter the name of the new column, then write the formula below. For example, you could add a new column called "Total" that multiplies the last price and size for each row in the table:
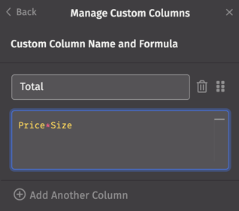
Select Save Column to add the new column to the table:
You can open the Custom Columns dialog again to edit your selections if you like. You can also add additional custom columns by clicking the + Add Another Column button.
If you have created multiple custom columns, it may be necessary to arrange the order of your custom columns for calculations to work correctly. To change the order of the new custom columns prior to showing them in the table, click the drag icon ( ) in the dialog and drop the column information to the desired position. To remove a custom column, click the trash can button (
 ) to the left of the column name, and select Save Column.
Copy Data to the Clipboard
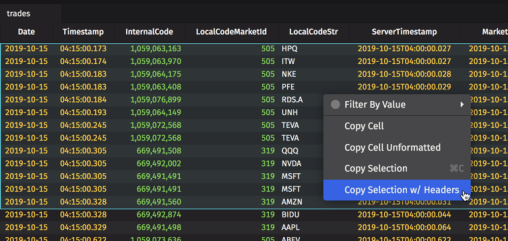
To copy data from a table to the clipboard, use the mouse to highlight the rows of data you want to copy. Then use the context (right-click) menu to select one of the copy options, as shown below.
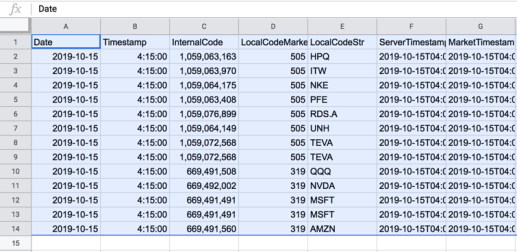
The copied data can then be pasted into a spreadsheet (or text editor):
Download CSV
You can export all or some of the rows in a Deephaven table into a CSV file to save on your local computer by selecting Download CSV from the Table Options menu.
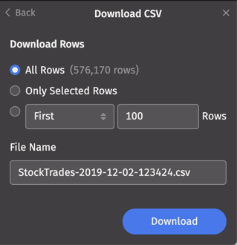
Choose from the following options:
- All Rows - This downloads the entire table. The number of rows appears in parentheses.
- Only Selected Rows - This downloads only the rows you have highlighted in the table. When rows are selected, the number of rows appears in parentheses.
- First/Last - This downloads rows from the start or end of the table. Select First or Last from the drop-down menu and then specify the number of rows you want to include.
A file name is automatically generated, but you can rename the file in the File Name field. After you click Download, the CSV file will save into the default location on your local computer.
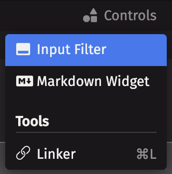
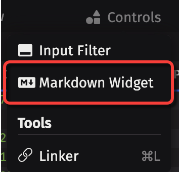
Controls
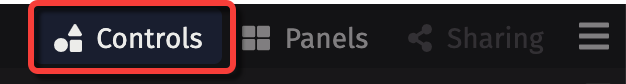
The Controls menu is located on the right side of the navigation bar and provides access to the Input Filter, the Markdown Widget and additional tools.
Input Filter
The Input Filter creates a filter that will be applied to all of the tables and OneClick plots in a given Dashboard or Code Studio.
Select Input Filter from the Controls menu. An Input Filter panel will be added to the Dashboard (or Code Studio).
Once a value is entered, the filter will be immediately applied to all tables (with that column present) in your Dashboard or Code Studio.
Closing the Input Filter panel removes all the associated filters from the workspace.
Markdown Widget
The Markdown Widget is a tool for including text (or images) in the Deephaven web interface. These notes can include references to the queries running in a Dashboard; code snippets/explanations; instructions/comments; messages to customers, clients or coworkers; contact info, etc.
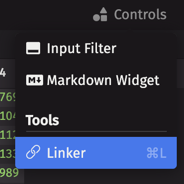
A Markdown Widget can be added to any Dashboard or Code Studio by selecting the Controls menu in the top navigation bar and then selecting Markdown Widget in the drop-down. Once a Markdown Widget has been added to the interface, its content can be edited by double-clicking in the panel.
Content contained in the widget can be styled using the Markdown syntax. Examples of this syntax follow:
|
Description |
Syntax |
Sample Output |
|---|---|---|
|
Heading Level 1 |
# Heading 1 Text |
Heading 1 Text |
|
Heading Level 2 |
## Heading 2 Text |
Heading 2 Text |
|
Heading Level 3 |
### Heading 3 Text |
Heading 3 Text |
|
Bold |
This is **bold text** |
This is bold text |
|
Italics |
This is *italic text* |
This is italic text |
|
Block Quote |
> This is a block quote |
|
|
Inline Code |
This is `inline code` |
This is inline code |
|
Code Block |
The following is a code block: ``` groovy I am groovy code ```
``` python I am python code ``` |
The following is a code block:
|
Additional styling options are available in Markdown, including tables, links, lists, horizontal lines, etc. To learn more, please refer to https://www.markdownguide.org/basic-syntax/.
To view a sample implementation, click +New, and then select "Markdown Example" in the "All Dashboards" list.
Saving, Re-opening and Deleting Markdown Widgets
Markdown Widgets are saved with the Dashboard or Code Studio in which they were originally created. If the Markdown Widget was open when the Dashboard or Code Studio is closed, the Widget will remain paired when it is reopened. If a Widget has been closed recently, it will appear in the Markdown Widget menu options.
For more information, please refer to Markdown Widgets.
Tools > Linker
The Linker feature in Deephaven enables a user to interactively filter the content in one table based on the content selected in another table. The objects must first be "linked" with each other, with one table as the source and one or more as the target. When a cell in the source table is double-clicked, the respective columns in the target table are filtered to that value.
To use the Linker, select the tool from the Controls menu. The following instructions will appear in Deephaven:
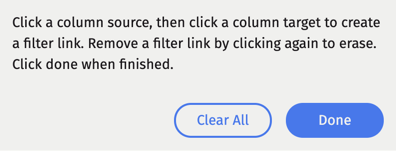
After you click a column source, an arrow will appear as you drag your cursor to your desired target. Note: the default (and only) operation is an equals filter.
Click Done to save your changes. In the example below, the Sym column in t2 (the source table) is being linked to the Sym column in t1 (the target table).
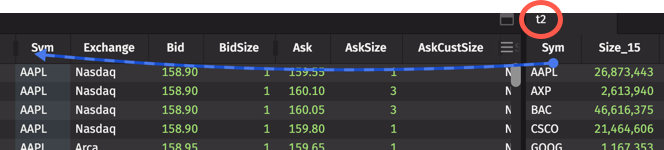
Now that the tables are linked, double-clicking on a row in the Sym column in t2 will automatically filter the contents of t1. As shown in the animation below, double-clicking on GOOG in the source table filters the target table to show only rows with the GOOG symbol.
To remove links between tables/columns, click Clear All. Use the Remove All Filters or Remove Column Filter in the table context menu to restore the tables to their original state.
Getting Started with Deephaven Classic
Deephaven Classic (the Java/Swing client) offers tighter integration between Code Studios, Notebooks, and Query Monitors. This is an important experience that allows one to migrate easily from ad hoc interrogation and development into the deployment of an app.
Additionally, the Swing client includes other front-end functionality not yet ported to the web UI, including the following:
You can take advantage of these features by installing Deephaven on your local computer.
Installing Deephaven
Deephaven Classic (the Java/Swing client) can be accessed via RDP to the provided virtual Windows Desktop.
The host will be provided to you. Note: Access to Port 3389 outbound from your proxy endpoint is required for communication with the host. Credentials to follow.
Deephaven Classic has been installed at that location, and can be launched by double-clicking the Deephaven icon in the upper left corner, as shown below.

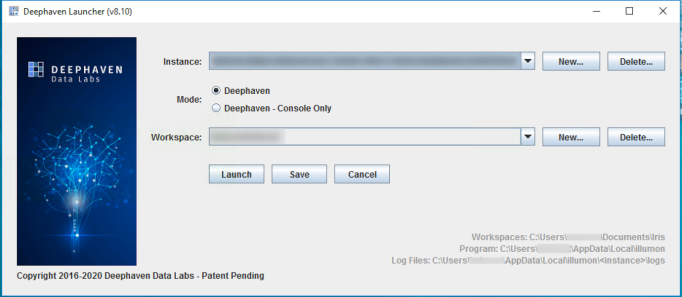
The following window will appear. Click Launch to access Deephaven.
After the appropriate files have been accessed and downloaded, you'll be asked to enter your username and password and click Login.
Creating a Workspace
Deephaven Classic allows you to build customized workspaces. These are equivalent to "Dashboards" in the web version of Deephaven.
After logging in to Deephaven, you'll see a completely blank workspace.
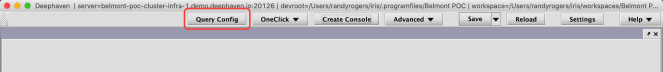
Click the Query Config button (highlighted above) to access the list of available Persistent Queries. Similar to the Panels option on the Deephaven web interface, the Query Config panel allows you to open tables and plots and then manipulate the data and arrange your tabs however you choose. The Query Config panel also allows you to create, view, and edit persistent queries. See the Exploring Persistent Queries section below to learn more.
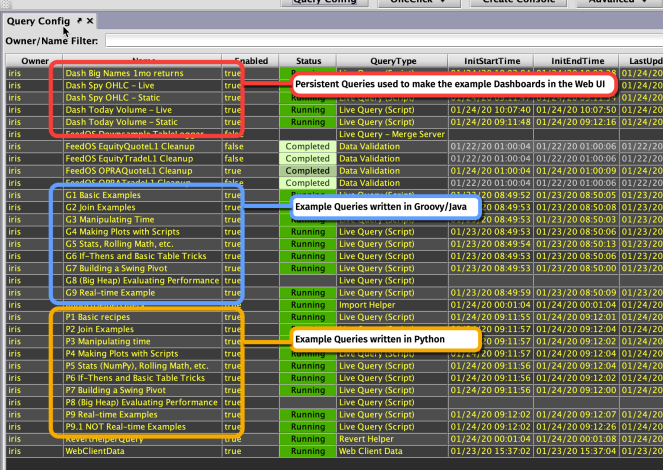
The five persistent queries outlined in red support the Dashboards we created for you.
To see the tables or plots associated with a Persistent Query, select the query name and then select Show Table and Show Widget buttons (at bottom of the UI) to display those objects in the workspace. For example:
- Select “Dash Today Volume Live” .
- Then select "todayVolumeLeadersWithPerc" from the Show Table drop-down menu at bottom.
- Then click Show Table .
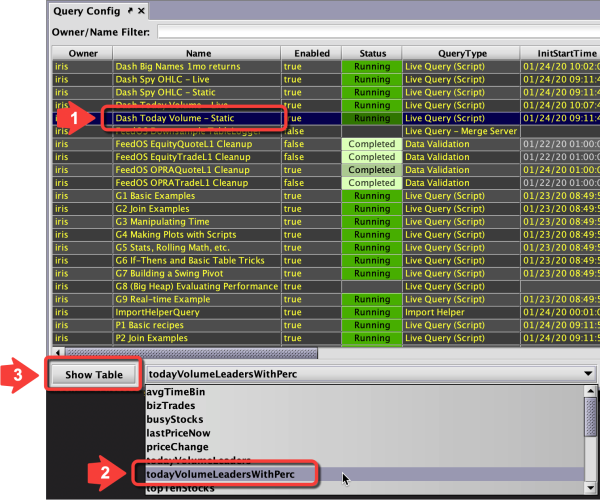
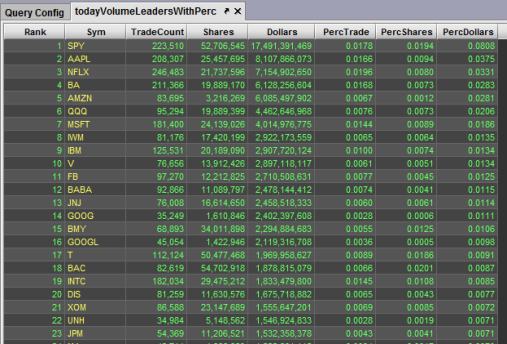
After clicking the Show Table button, the "todayVolumeLeadersWithPerc" table will open in the workspace, as shown below.
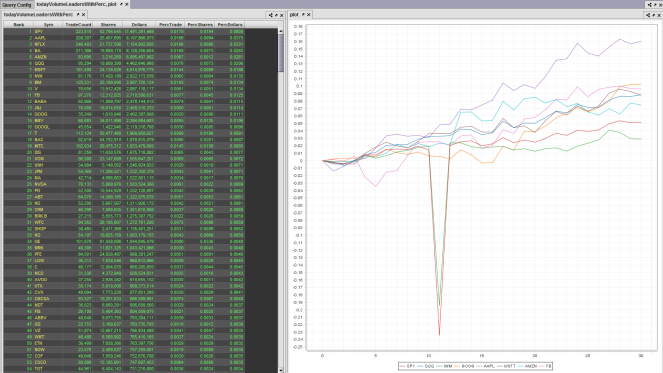
Now, return to the Query Config window and highlight the Persistent Query "Dash Big Names 1 mo returns". Then open the drop-down menu next to the Show Widget button and select "plot". The associated plot will open in a new tab next to your opened table. However, you can drag-and-drop and resize your panels to rearrange your layout, as demonstrated below.
Exploring Persistent Queries
Persistent Query Configuration Editor
Creating Persistent Queries in Deephaven Classic and in Deephaven's web interface is similar. However, the Persistent Query Configuration Editor in Deephaven Classic also provides options for Access Control and Scheduling.
Note: Access Control and Scheduling will be added to the web interface in the next release.
To access the Persistent Query Configuration Editor, open the Query Config panel. On the right side of the interface is the Configuration section, which provides options to create, copy, view, edit and revert persistent queries. In the following example, we'll show you how to edit an existing Persistent Query.
- First, highlight the Persistent Query named, "Dash Today Volume - Live".
- Then click Edit.
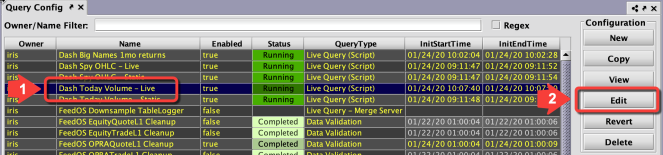
That will open the Persistent Query Configuration Editor as shown below.
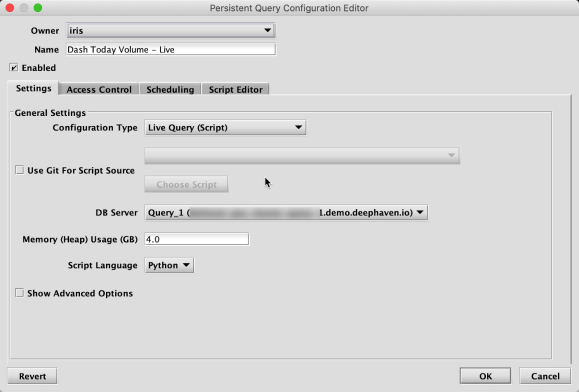
There are four tabs at the top of this window, and each allows you to control certain execution aspects for the query. See below for more details on each.
Settings
If you were creating a new Persistent Query, you would need to select the appropriate configuration options. However, we will leave the existing settings intact for this example.
- Configuration Type
- DB Server
- Memory (Heap) Usage
- Script Language
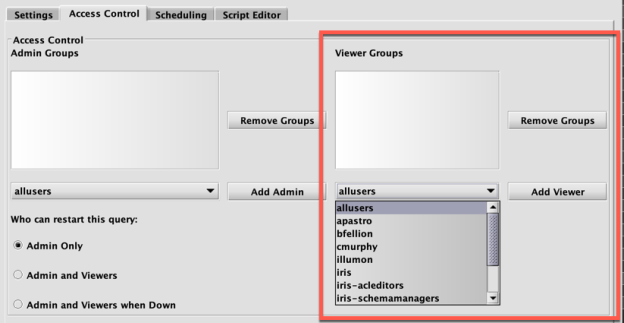
Access Control
The Access Control panel enables query authors to set permissions for who can view or edit your query. A Persistent Query is always accessible to its author. However, you can make your query accessible to all users or select users and groups. For example, if you'd like other users to be able to access your query in the Panels menu in Deephaven's web UI, you'll need to add them as a viewer in Deephaven Classic using the Viewer Groups section of this tab.
Scheduling
You can choose several scheduling options for your query. By default, the query will run as a daily, real-time updating query.
Script Editor
The Script Editor is used to enter (or edit) the text of the query. In the following screenshot, the Script Editor contains the query language used to create the tables and plots associated with "DashTodayVolumes - Static" Persistent Query. For example, line 7 below begins the query that creates the "todayVolumesLeadersc" table.
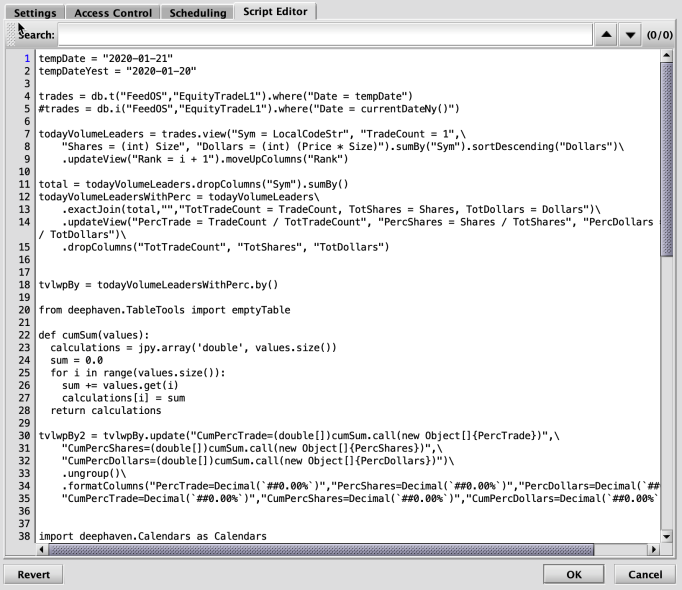
There are, of course, many more options available in the editor. For full details, see Query Configuration.
To create your own Persistent Query, click the New button in the Configuration section of the Query Config panel. However, you can also create Persistent Queries in the Console, which we'll cover in the Deephaven Notebooks section below.
Example Queries (G1-9 and P1-9)
Looking through other available Persistent Queries can illuminate the Deephaven query language and the building blocks of a workspace. We've included several example queries, including some pasted from the Deephaven Example Notebooks.
Looking at the scripts for these Persistent Queries, respectively, will help teach you about the Deephaven table library and embedding Python (or Java) within scripts. These are documented inline.
The sample queries that come with Deephaven have been built as learning tools to introduce users to our table library. The names prefaced with "Gr" are written in Groovy; the names prefaced with "Py" are written in Python.
- Basic Examples - Provides a look at the core functionality for querying within Deephaven.
- Join Examples - Focuses on the unions of different tables.
- Manipulating Time - Provides examples of how to work with time in your queries, such as filtering by time or converting to DateTime.
- Making Plots with Scripts - Demonstrates methods for visualizing data.
- Stats, Rolling Math, etc - A collection of slightly more sophisticated manipulations.
- If/Thens and Basic Table Tricks - Provides additional functionality to take your querying to the next level.
- Building a Pivot Widget - A template for creating a pivot widget (only viewable in the Swing client).
- Evaluating Performance - Demonstrates the speed of the Deephaven system by performing huge tasks in a short time. Note: This query requires a lot of memory, so its status defaults to “Disabled”.
- Real-time Example - Demonstrates real-life scenarios using live, ticking data.
Launching a Console
Consoles are used to interrogate data, perform ad hoc analysis, and develop persistent queries. What Deephaven Classic calls a “Console” is fundamentally the same as the “Code Studio” in Deephaven's web interface.
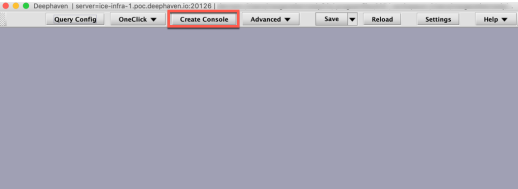
To get started, click Create Console at the top of the interface.
You have the option to choose the query server on which you want to run this worker, how much Heap Size (in GB) to provision for the pending work, and whether you want a Groovy or Python session.
In this document, all examples will be in Python.
![]()
Open a Table
Just as in the Deephaven Code Studio, tables and charts generated by console-based queries are added to the Console window as new panels that can be arranged by the user. Either copy/paste or type the following query and press Enter/Return:
trades = db.i("FeedOS", "EquityTradeL1").where("Date=currentDateNy()")
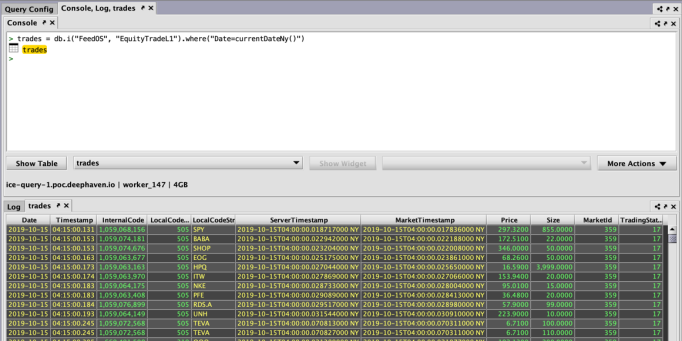
You can open tables and widgets generated in your existing session using the Show Table and Show Widget buttons at the bottom of the Console window. The Log panel directly under the Console window records relevant details or error messages.
Show History
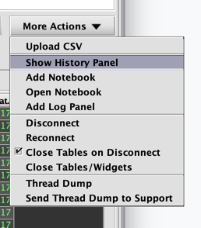
Open the History panel from the More Actions button to easily access your previous commands.
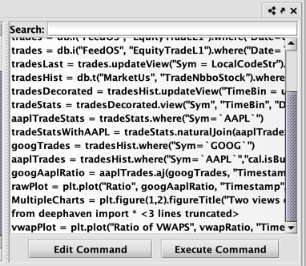
Right-click one or more selected commands to copy them to your clipboard or into a new Deephaven Notebook.
Deephaven Notebooks
The Deephaven Notebook serves as a "sandbox" where users can develop query components, stage draft queries, or simply store notes. Full Notebooks or selected lines can be run in the Deephaven Console.
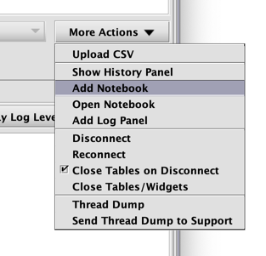
Add a Notebook panel or open an existing Notebook from the More Actions menu at the bottom right of the Console:
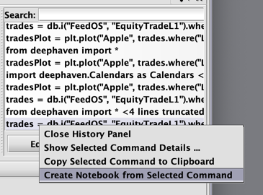
You can also create a new Notebook after highlighting a command in the History Panel. For example, right-click on the "trades" table created above from the History panel and then select Create Notebook from Selected Command from the context menu.
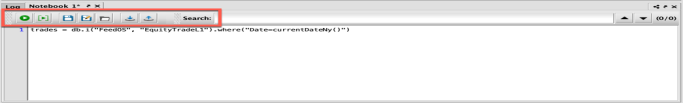
This will create and open a new Notebook where you can continue to edit and develop your script.
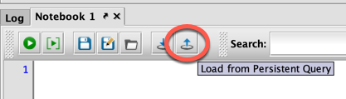
The Notebook toolbar (highlighted below) enables you to execute the full Notebook, run part of or all of a Notebook, save the Notebook to your local file system, load a Notebook from a file, save the content to a Persistent Query, or load an existing Persistent Query script into the Notebook.
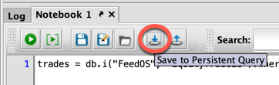
Select Save to Persistent Query for the following options:
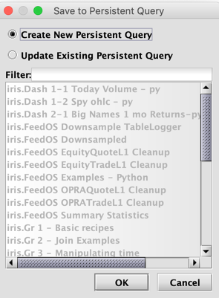
Select Create New Persistent Query to open the Persistent Query Configuration Editor with your script copied into the editor. You will need to choose a unique name for your query and configure the Settings as discussed previously.
Select Update Existing Persistent Query followed by a query name from the list below to replace the text of an existing query with the script in your Notebook.
The Notebook toolbar can also be used to open existing Persistent Query scripts. Select the Load from a Persistent Query button:
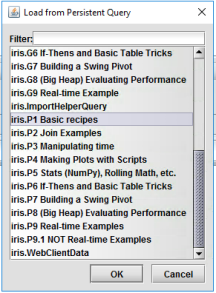
Here you will see a list of the persistent queries available to you in the Query Config panel, including the example queries. Select "iris.Py 1- Basic Recipes", as shown below:
Note: these scripts are written in Python and require a Python Console session to execute.
This opens the full text of the Persistent Query in the Notebook panel.
Importing a CSV with Upload CSV
Once the Console has connected to a server, Upload CSV can be selected from the More Actions drop-down menu:
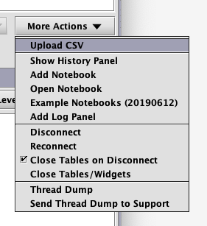
The user can then upload a CSV file from the client machine’s local storage system.
For this example, we’ve chosen a CSV file from the internet itemizing purchase orders (https://catalog.data.gov/dataset?tags=commodities).

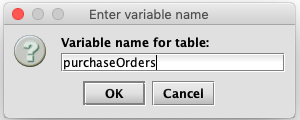
After selecting the file, enter a name to use for the table that will be created by parsing the contents of the file.
Once the file has been uploaded and parsed, the resulting table will be displayed in the Deephaven console.
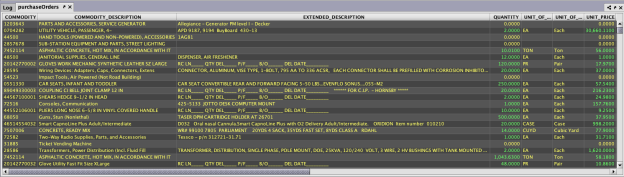
Within your console experience, you can now write queries that refer to that imported table’s name (i.e., “purchaseOrders”). For example:
twoColumns = purchaseOrders.view(“COMMODITY”, “COMMODITY_DESCRIPTION”)
Note: This table exists only as a temporary table in your console workspace. To save it permanently, you will need to follow the instructions itemized in the User Tables section later in this document.
Working with Tables and Plots
The column header menus and table context menus in Deephaven provide several options for manipulating your data directly in the user interface. You can sort and filter data, create custom columns, freeze columns, link tables and plots, or quickly roll-up your data or create plots.
Right-click on any table header or within the table itself to see the available options.
| Column Header Menu | Table Data Menu |
|---|---|
|
|
|
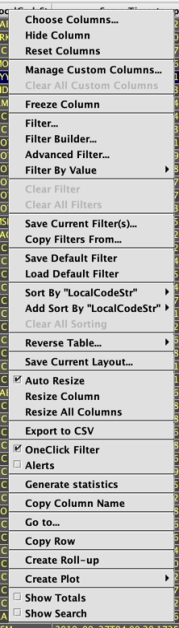
Please review the full documentation to learn about all right-click table shortcuts.
Sort
To sort a column, click the column header once for ascending order, a second time for descending order, and a third time to return to the original order.
Once a table has been sorted in this fashion, an "up" arrow or "down" arrow will appear to the right of the column name to indicate the sort and the order. See below:
Filter
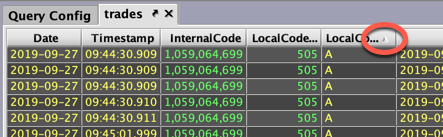
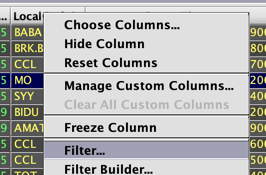
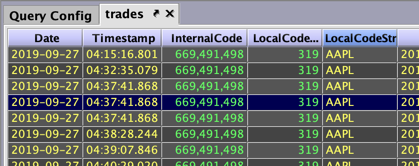
To apply a simple filter, right-click on that column's header and select Filter to open the configuration dialog. In this example, we've right-clicked the LocalCodeStr column header, which contains the symbol column.
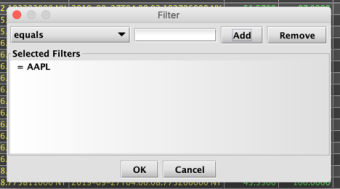
In the Filter dialog, select the filter type from the drop-down menu, type a value in the text field (e.g., "AAPL"), and select Add. When you're done adding filters, click OK.
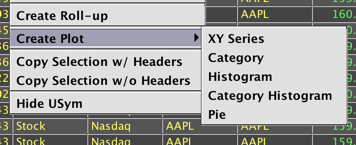
Plot
Users can create plots directly in the user interface using the Create Plot option in the right-click table data menu. These plots can be saved as part of your workspace and will reappear when you open a saved workspace.
To learn more about each option, see Working with Plots. To review our plotting methods using the Deephaven Query Language, see Plotting.
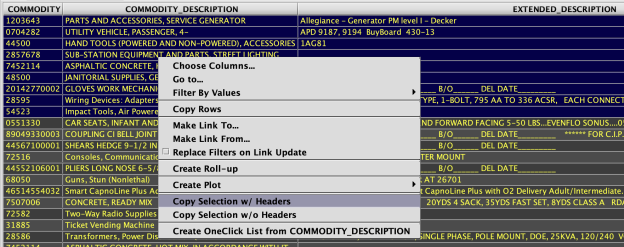
Copy Data to the Clipboard
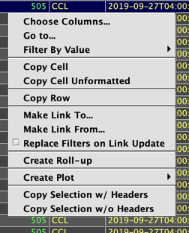
In both the web and Classic consoles, sets of rows can be selected in the grid and then copied to the Clipboard using the context menu (right-click) and selecting Copy Selection with or without column headers included.
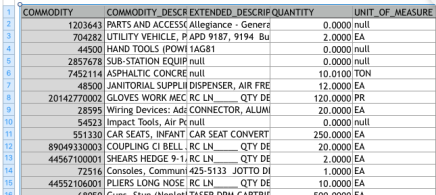
This copied data can then be pasted into a spreadsheet (or text editor):
Export to CSV
Similarly to the Upload CSV functionality, data from Deephaven tables can be exported to CSVs, with a UI feature to download a file to the user's machine from the Classic console.
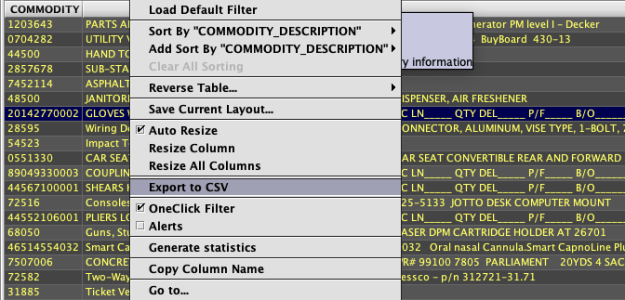
From the context menu (right-click) on the header of a table, select Export to CSV.
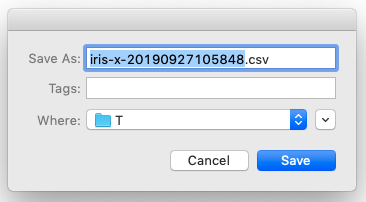
Then choose where to save the file on your local system.
Basic Import and Export of Data
Importing a CSV with readCsv()
Earlier, we showed you a way to upload CSVs from your client machine to the Deephaven system using the Swing Console. There is another, more programmatic way for importing CSVs called readCsv(). However, the readCsv() method requires the file being imported to be accessible from the Deephaven server, rather than the client machine.
Note: Both CSV importing methods are explained in detail in the Importing Data section of our full documentation.
The readCsv() method is available from the Deephaven query language. It can be used in queries and scripts anywhere the Deephaven query language commands can be run.
The following example shows it being used in a Groovy web console.
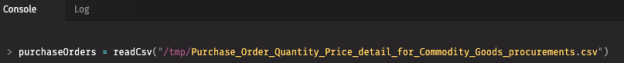
From Python, the command will be similar, but you will need to specify the ttools context for the readCsv method.
purchaseOrders = ttools.readCsv("/tmp/Purchase_Order_Quantity_Price_detail_for_Commodity_Goods_procurements.csv")
Note: the file must be readable by the "dbquery" user account on the Deephaven server.
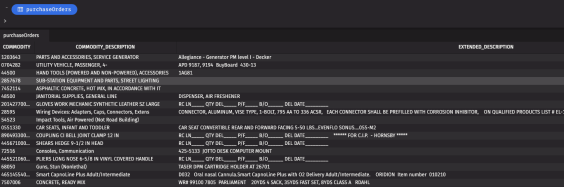
Once the file has been read and parsed, the resulting table will be displayed in the Deephaven console.
Working with the Imported Data
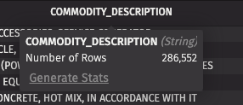
The "purchaseOrders" table created by the above examples is a regular Deephaven table. However, it exists only in memory for the current console session. Details about the table can be seen by hovering over column headers and selecting Generate Statistics, as shown below.
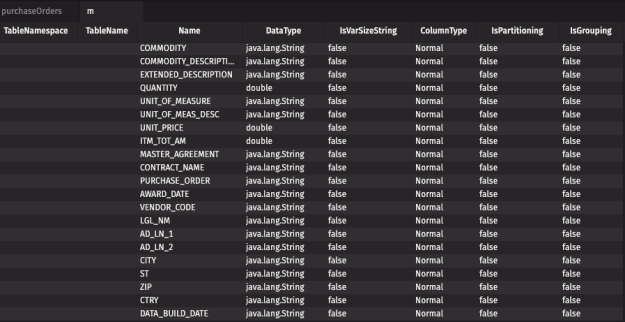
You can also use the getMeta() method, to create a table that contains the metadata (column names, types, etc) for the table. For example, the following query creates a new table showing the metadata for the table named "purchaseOrders":
m = purchaseOrders.getMeta()
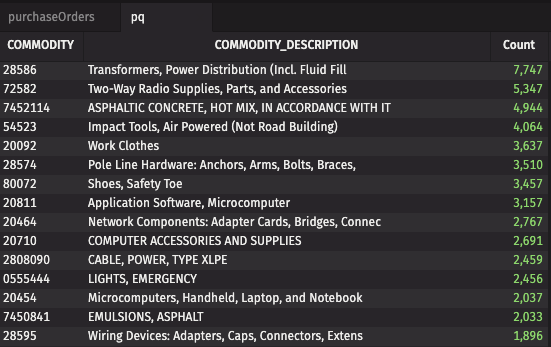
Queries can be written using this import-created table just like any other table. For example, the following query creates a new table showing counts of orders by commodity ID and description.
pq = purchaseOrders.select("COMMODITY","COMMODITY_DESCRIPTION") .countBy("Count","COMMODITY","COMMODITY_DESCRIPTION").sortDescending("Count")
Exporting Data
There are several methods to export data from Deephaven. Two convenient ones are copying to the clipboard and exporting to CSV, as discussed in the Deephaven Classic introduction. You can also use the writeCsv() method as shown below.
From Python:
ttools.writeCsv(POs, "/tmp/PurchaseOrders.csv")
From Groovy:
writeCsv(POs, "/tmp/PurchaseOrders.csv")
Both of these examples accomplish the same thing: writing the contents of the Purchase Orders table to a CSV file called PurchaseOrders.csv in the /tmp directory on the query server. The name or address of the query server in use can be seen in the status message above the table grid in a Classic console, or in the status message in the top right corner of the code window in a web console's Code Studio.
User Tables
Making CSVs Available Permanently
A table imported to Deephaven using Upload CSV or readCsv() exists only in the memory of the current worker session. Nothing is persisted by these commands. To make such a table more permanent, its data can be written to a user table.
User tables are on-disk tables that store data in much the same way as regular Deephaven tables. Initially, they are accessible only to the user who created them (and superusers), but access permissions can be granted to other users as well. (See Permissions).
When creating user tables, a namespace needs to be specified as well as the new table name. By default, regular users have permissions to a namespace that matches their username, so that should be the namespace used by regular users when creating new user tables. This syntax is the same regardless of the language or console type being used.
For example, the following query creates a new user table, in the "myUsername" namespace, with the name "PurchaseOrdersSavedTable", and populates it with the data and structure of the "purchaseOrders" source table that was created in memory:
db.addTable("myUsername","PurchaseOrdersSavedTable", purchaseOrders)
The new table can then be used similarly to other Deephaven tables:
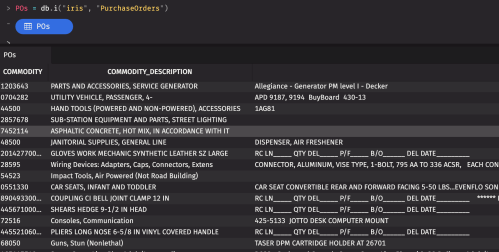
(Note that this user table was retrieved using db.i().)
If needed, the user table can be replaced using db.replaceTable() method as shown below:
db.replaceTable("myUsername","PurchaseOrdersSavedTable", newPurchaseOrders)
It can also be deleted using the db.removeTable() method:
db.removeTable("myUsername", "PurchaseOrdersSavedTable")
For more details, see Managing Data in User Tables.
Need Help?
If you'd like some assistance, there are four methods for reaching out to Deephaven Customer Support:
The email address for Deephaven Customer Support is [email protected]. Responses to email inquiries are processed as quickly as possible.
Live Chat
The link to Chat is located on every page of the Deephaven Documentation Portal and on www.deephaven.io/help. Support representatives are available to assist via Live Chat from 7 a.m. to 5 p.m. Eastern time, Monday through Friday.
Note: Live chat is not available on U.S. Bank Holidays.
Telephone Support
The Deephaven Support Team can be reached by calling +1 (855) 828-8445. Support representatives are available to assist via telephone from 7 a.m. to 5 p.m. Eastern time, Monday through Friday.
Note: Telephone support is not available on U.S. Bank Holidays.
Links within Deephaven Classic
There are four ways to contact Deephaven Customer Support from within the classic Deephaven workspace.
- Help Button
- Through the Log Panel
- Through the Query Configuration Window
- Send Thread Dumps to Support
Last Updated: 16 February 2021 18:06 -04:00 UTC Deephaven v.1.20200928 (See other versions)
Deephaven Documentation Copyright 2016-2020 Deephaven Data Labs, LLC All Rights Reserved