Query Configuration
The Query Config button is used in Deephaven to open the Query Configuration window, which contains information about all of the persistent queries you are authorized to view in Deephaven.

Persistent Queries Overview
Persistent queries operate just like console-based queries. However, persistent queries are created and saved, thereby enabling the automation of repetitive and/or timed operations. Also, persistent queries can be shared with other individuals or teams.
Additional information about persistent queries follows in the sections below.
The Query Configuration Window
To view and manage persistent queries in Deephaven, click Query Config at the top of the interface.
This will open the Query Configuration window as shown below.
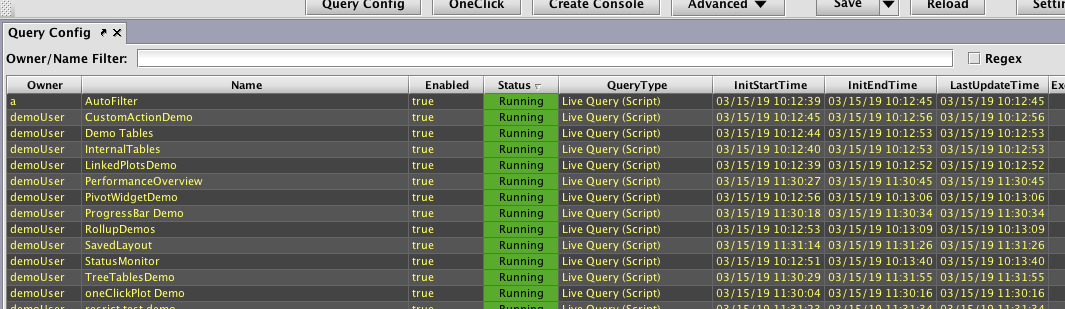
Information about each query is stored in columns, including the owner name, the query name, whether it is enabled, its status and type, etc. You can sort through these queries by clicking on the column name - once to sort in ascending order, twice to sort in descending order.
Just below the tab name is the Owner/Name Filter field. By typing the first few letters of an owner's name or the query name into the field, the list of available queries presented will be filtered to include only those with the characters you typed.
On the right side of the Query Configuration window is a section containing options for Configuration and Administration.
All users can click New to create a new persistent query (see Creating a New Persistent Query). Other options may be presented when you click anywhere in a row for a specific query. See below:
|
Screen view if you are not authorized to see/edit a query |
Screen view if you are authorized to see/edit a query |
|---|---|
|
|
|
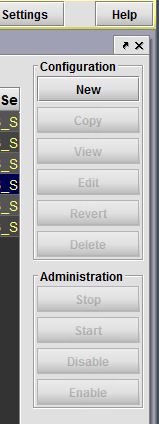
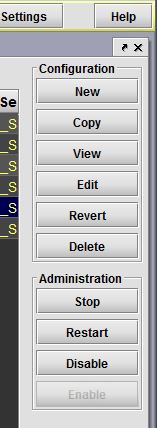
If you authored the query selected, or if the query author provided you with authorization, the Configuration panel on the right side of the window will display the following options:
- Copy - See: Copying a Persistent Query
- View - See: Viewing a Persistent Query
- Edit - See: Editing a Persistent Query
- Revert - See: Reverting a Persistent Query
- Delete - See: Deleting a Persistent Query
Clicking any of these options (other than "Delete") will open either the Persistent Query Configuration Viewer or Persistent Query Configuration Editor. See: Persistent Query Configuration Viewer/Editor.
Options in the Administration section include the following options:
- Stop - See: Stopping a Persistent Query
- Start (or Restart) - See: Starting (or Restarting) a Persistent Query
- Force Start (or Force Restart) - See: Force Starting (Force Restarting) a Persistent Query
- Disable - See: Disabling a Persistent Query
- Enable - See: Enabling a Persistent Query
Right-click Shortcuts
The Query Configuration window is a table generated by Deephaven. As such, right-clicking on any of the column names or within any of the rows will generate many of the same shortcut options as any other table in Deephaven. These include, but are not limited to, hiding/showing certain columns, changing the order of columns, filtering, sorting etc. For additional information about these options, please refer to Working with Tables.
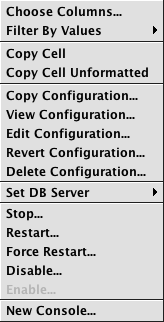
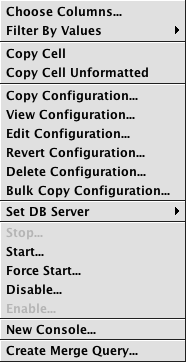
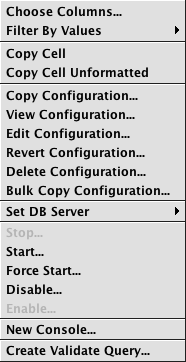
If you are the query author (or have proper authorization), additional options are presented when you right-click in one of the rows. Different options also appear depending on the type of query selected. These additional options are depicted below.
| Right-click on a script query | Right-click on an import query | Right-click on a merge query |
|
|
|
The options Choose Columns, Filter By Value, Copy Cell and Copy Cell Unformatted are the same as those presented in any other table in Deephaven.
Please refer to Working with Tables for information about these options.
The next set mirrors options presented in the Configuration panel on the right side of the Query Configuration window.
- Copy Configuration - Selecting this option in the shortcut menu copies the properties of the query and opens the Persistent Query Configuration Editor so you can name and save the new persistent query. For additional information, please refer to: Copying a Persistent Query.
- View Configuration - Selecting this option in the shortcut menu opens the Persistent Query Configuration Viewer, which enables you to examine properties/settings of the query. For additional information, please refer to: Viewing a Persistent Query.
- Edit Configuration - Selecting this option in the shortcut menu opens the Persistent Query Configuration Editor, which enables you to review and edit the query properties/settings. For additional information, please refer to: Editing a Persistent Query.
- Revert Configuration - Selecting this option in the shortcut menu opens the Query Configuration Revert Tool window, which enables you to revert some or all of the properties/settings of the query. For additional information, please refer to: Reverting a Persistent Query.
- Delete Configuration - Selecting this option in the shortcut menu will open a dialog window asking you to confirm the deletion of the query. If you click Yes, your query will be deleted. For additional information, please refer to: Deleting a Persistent Query.
- Bulk Copy Configuration - this option is only visible when a single import, merge, or validate query is selected. Selecting it allows the user to create a bulk set of queries based on the selected query. See the Bulk Copy Configuration section for further details.
- Set DB Server - When clicked, Set DB Server shows the currently designated DB Server for this query. If only one DB Server is available, then that one server is the only option presented and no change can be made. If more than one DB Server is available, the additional options will be presented and if desired, can be changed. Note: If the query is running at the time the server is changed, the query will stop and then restart using the new DB Server.
The next set of shortcuts mirror the options presented in the Administration panel on the right side of the Query Configuration window.
- Stop - Selecting this option stops the query. For additional information, please refer to: Stopping a Persistent Query.
- Start (or Restart) - Selecting this option starts (or restarts) the query. For additional information, please refer to: Starting (or Restarting) a Persistent Query.
- Force Start (or Force Restart) - Selecting this option stops (or force stops) the query. For additional information, please refer to: Force Starting (Force Restarting) a Persistent Query.
- Disable - Selecting this option disables the query. For additional information, please refer to: Disabling a Persistent Query.
- Enable - Selecting this option enables the query. For additional information, please refer to: Enabling a Persistent Query.
- New Console - Selecting this option opens a new console window for this query. If the query is enabled and running, any tables and plots associated with this query will be available for further analysis. If the query is disabled or stopped, it will need to be enabled and/or started before any data becomes available.
Depending on the query type selected, the following options may also be available.
- Create Merge Query - if a single import query is selected, then this option is presented. Selecting it creates a merge query based off the selected import query. For additional information, please refer to: Data Merge Query
- Create Validate Query - if a single merge query is selected, then this option is presented. Selecting it creates a validate query based off the selected import query. For additional information, please refer to: Data Validation Query
Persistent Query Configuration Viewer/Editor
The "editor" version of this window allows query authors and other authorized users to make changes related to a specific persistent query. The "viewer" version of the window allows users to only view the content.
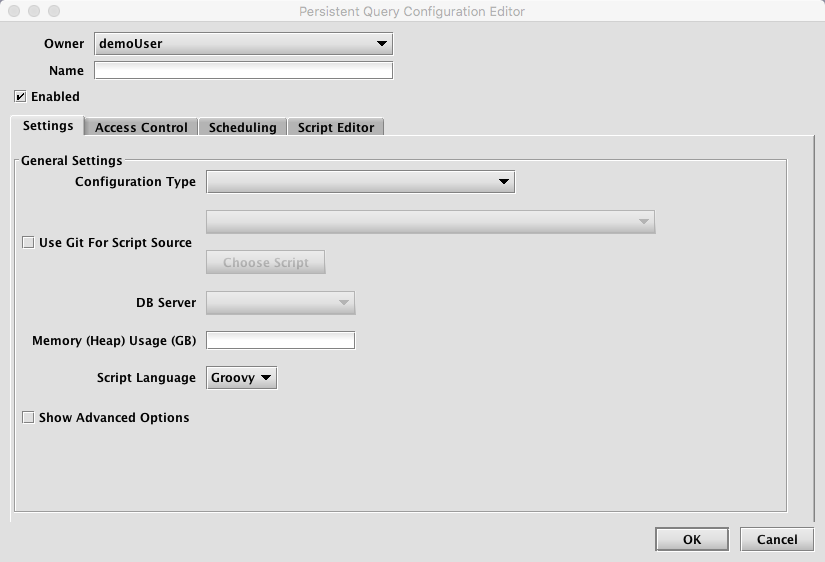
Owner - The query author's username is automatically added as the owner for that query.
Name - Query names can be any combination of characters and numbers. However, each query in a given installation of Deephaven must have a unique name.
Enabled - When Enabled is selected, the query will attempt to run according to its schedule as soon as you click OK at the bottom of this panel. If you do not want the query to run upon completion, deselect the check box.
Settings
When the Persistent Query Configuration Editor window opens, the Settings tab will be open.
Configuration Type
The first setting to determine is the Configuration Type. The options below are available in most installations. However, additional options may be available, depending on the Deephaven customization performed by your local administrator.
- Batch Query - Import Server
- Batch Query (RunAndDone)
- Data Merge
- Data Validation
- Import - CSV
- Import - Deephaven Binary Logs
- Import - Downsample
- Import - JDBC
- Import - XML
- In-Worker Service
- Live Query (Script)
- Live Query - Merge Server
- Live Query Replay - (ReplayScript)
Batch Query - Import Server, Batch Query (RunAndDone), Live Query Replay - (ReplayScript), and Live Query (Script) pertain to running scripts in the Deephaven Console. These options are further described below.
Import - Deephaven Binary Logs, Import - CSV, Import - JDBC and Import - XML are used for importing data from Deephaven binary log, CSV, JDBC and XML data sources respectively. Import - Downsample reads data from an existing table and imports a downsampled version. Data Merge is used for merging intraday data to historical data. Data Validation is used to validate data and to delete merged intraday data. These configurations are further described in the Importing Data Guide.
The In-Worker Service configuration type is configured to run Deephaven processes within workers. This configuration type is only visible to system administrators.
When the In-Worker Service configuration type is selected in the Configuration drop-down menu, the InWorkerService Settings tab is added to the panel as shown below.
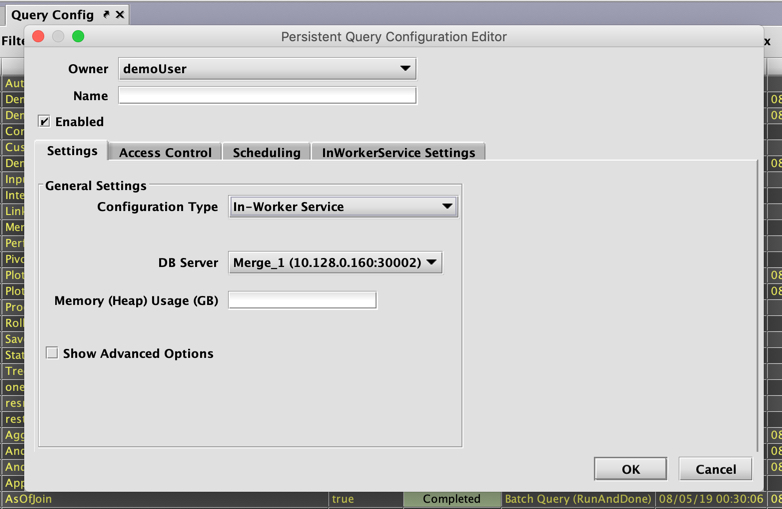
This allows the selection of different service types.
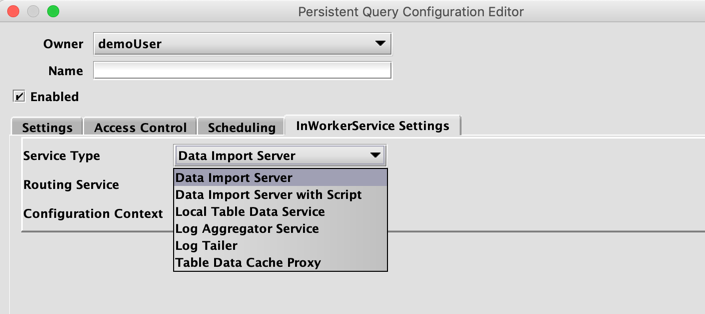
Each Service Type will have its own configuration options.
- Data Import Server
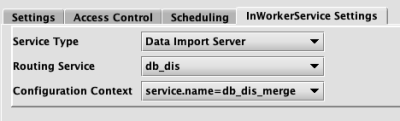
- Routing Service - This is the routing service, from the Routing Service configuration. Only routing services from the
dataImportServerssection will be shown.
- Configuration Context - This is the context within the properties file.
- Data Import Server with Script
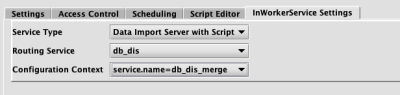
This runs a Data Import Server with a script, making last-by variables available to the script. This adds a Script Editor panel to the editor, along with the appropriate script options to the Settings tab. This service is available to members of the
iris-datamanagersandiris-dataimportersgroups.
- Routing Service - This is the routing service, from the Routing Service configuration. Only routing services from the
dataImportServerssection will be shown.
- Configuration Context - This is the context within the properties file.
- Local Table Data Service
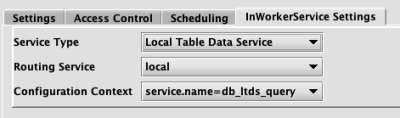
- Routing Service - This is the routing service, from the Routing Service configuration. Only routing services from the
tableDataServicessection will be shown.
- Configuration Context - this is the context within the properties file.
Log Aggregator Service
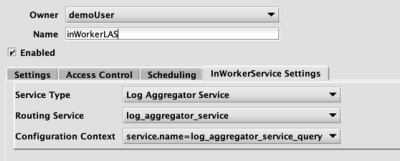
- Routing Service - This is the routing service, from the Routing Service configuration. Only routing services from the
logAggregatorServerssection will be shown.
- Configuration Context - this is the context within the properties service.
- Log Tailer
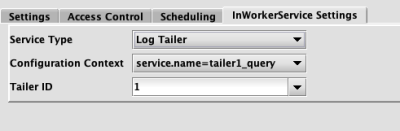
- Configuration Context - This is the context within the properties file.
- Tailer ID - This is the log tailer's ID. It can be selected from the drop-down menu, or typed in.
- Table Data Cache Proxy
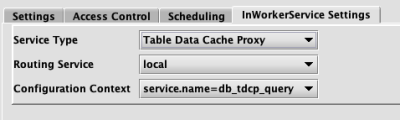
- Routing Service - This is the routing service, from the Routing Service configuration. Only routing services from the
tableDataServicessection will be shown.- Configuration Context - this is the context within the properties file.
Note that when an in-worker service is added, it will usually be necessary to remove the appropriate service from monit. The following example shows how to add an in-worker Local Table Data Service; the commands should be adjusted appropriately for other services. All the commands should be run on the system where the in-worker service will be run.
- First stop the service.
sudo monit stop db_ltds - Ensure the process is stopped. After a few seconds, the following command should not return any output.
ps -ef | grep ltds | grep -v grep - Using the Deephaven query configuration panel in the console, add the service as an in-worker service persistent query.
- Disable the service in monit (to ensure monit will not start the process next time there is a restart). Do not use the extension ".disabled" for this because it could become re-enabled when other scripts are run.
sudo mv /etc/sysconfig/illumon.d/monit/db_ltds.conf /etc/sysconfig/illumon.d/monit/db_ltds.in_worker - If monit is running with individual entries for each Deephaven service, comment out the appropriate entry.
sudo vi /etc/monitrc
# include /etc/sysconfig/illumon.d/monit/db_ltds.conf - Reload the monit configuration.
sudo monit reload
Deephaven Console Scripts
Batch Query (RunAndDone) and Batch Query - Import Server
As the name implies, Batch Query (RunAndDone) and Batch Query - Import Server queries are designed to run one time and then stop. Batch Query (RunAndDone) queries can operate only on a query server, where as Batch Query - Import Server queries can only operate on a merge server. Also, the option to select Batch Query - Import Server queries are only available to members of the
iris-datamanagersoriris-dataimportersACL groups.These queries can be scheduled for certain times and/or dates by using the settings in the Scheduling tab (see below) in the Persistent Query Configuration Editor. All scheduling parameters are available except for the following:
- Batch Query (RunAndDone) and Batch Query - Import Server queries stop immediately after completion. Therefore, the query's End Time option is unavailable.
- Batch Query (RunAndDone) and Batch Query - Import Server queries must have a non-zero timeout established, which defines how long the query is allowed to run before it is terminated.
To create a Batch Query (RunAndDone) or Batch Query - Import Server query that activates only when manually triggered, select Disable Scheduling.
When used with real-time data, Batch Query (RunAndDone) and Batch Query - Import Server queries are processed using the data available during initialization of the query. To update the results with subsequent data, you must restart the query.
Live Query Scripts and Live Query - Merge Server
Scripts are the most common type of configuration. There are two types of script queries, but both operate in the same way.
- Live Query (Script) - this is a script that runs on a query server.
- Live Query - Merge Server - this is a script that runs on a merge server. These are only available to users that have the appropriate privileges.
They can be written via the Script Editor tab on this same panel. Alternatively, the script can be hosted in a Git repository.
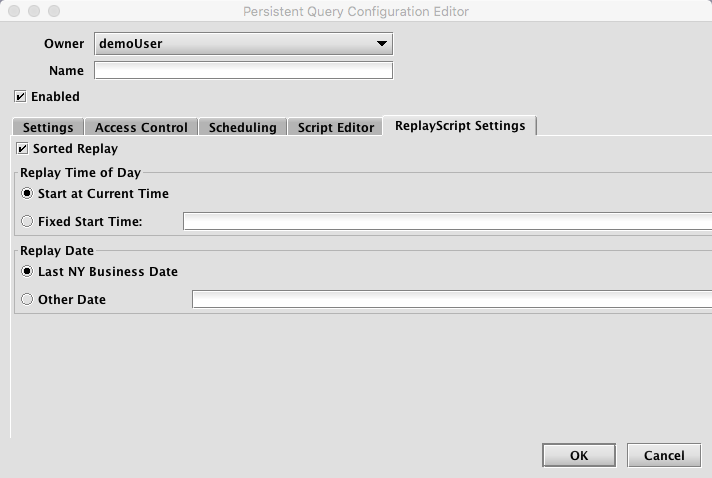
Live Query Replay - (ReplayScript) scripts are configured to replay historical data the same as it was received when it was live, ticking data. For instance, if the price of a certain security changed dramatically during a specific period in the past, you could create a Live Query Replay - (ReplayScript) script that would re-run that period's price activity as if it were live.
When Live Query Replay - (ReplayScript) is selected in the Configuration drop-down menu, the Replay Script Settings tab is added to the panel as shown below.
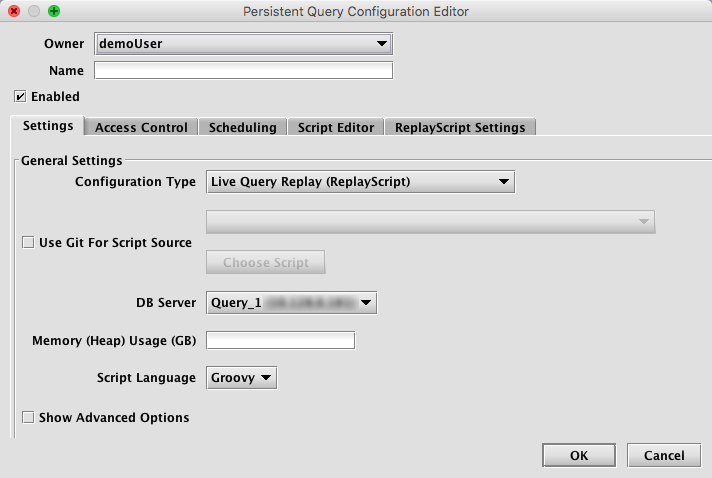
This tab allows you to set additional parameters for the Live Query Replay - (ReplayScript) as shown below:
What if...
...my Timestamp column is not "Timestamp"
A Replay Query will assume that the replay Timestamp column in all tables is "Timestamp” unless you have defined it otherwise. If your Timestamp column is named something else - say “TradeTime” - you must tell the query that. This must be done by adding additional arguments to the “Extra JVM Arguments” of the query. You should add this for each table that does not have a Timestamp column.
-DReplayDatabase.TimestampColumn.<Namespace>.<Table Name>=<Column Name>
For example:
You can also specify the name on a per namespace or global level. More specific properties, override less specific properties:
-DReplayDatabase.TimestampColumn.<Namespace>
-DReplayDatabase.TimestampColumn
...my data to Replay is in Intraday space
You can select intraday data instead of historical data by using the
ReplayDatabase.UseIntradayproperties. As with the Timestamp column, more specific properties override less specific properties.-DReplayDatabase.UseIntraday.<Namespace>.<Table Name>=true
-DReplayDatabase.UseIntraday.<Namespace>=true
-DReplayDatabase.UseIntraday=true
By default, historical tables are used.
Use Git For Script Source
Query scripts are often written and stored within the Script Editor window in Deephaven. However, you can also store your query script in a Git Repository as long as the repository is accessible to Deephaven. (Please consult with your system administrator to see if access to a Git Repository is possible for your installation. See also Integrating Git with Deephaven.) When checked, you can select the appropriate script in that repository to associate with this persistent query.
![]() If you have a script already written in the Script Editor window and then select Use Git For Script Source, a dialog will open to alert you that your current script code will be lost if you choose to continue.
If you have a script already written in the Script Editor window and then select Use Git For Script Source, a dialog will open to alert you that your current script code will be lost if you choose to continue.
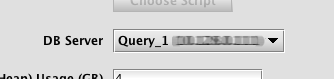
DB Server
The DB Server setting allows you to select the database server associated with your installation of Deephaven and the chosen query configuration type.
Server classes determine what types of queries can be run on each server, and are used by the console to determine which database servers a user can select for each query type.
A Deephaven installation has two server classes configured by default:
- Merge - this class is for servers and queries that need to load data into the database, either intraday (such as the import queries), or historical (the merge query).
- Query - this class is for queries that query data but do not need to write it, such as scripts.
When creating or editing a persistent query, the Persistent Query Configuration Editor will automatically populate the DB server field with appropriate options: e.g., "Merge_1" for a merge or import query, or "Query_1" for Live Query script queries. An example screenshot follows:
Please contact your system administrator for specific server information related to your installation.
Memory (Heap) Usage (GB)
The Memory (Heap) Usage (GB) setting refers to the dynamic memory (RAM) available in Deephaven to process the instructions and the data needed to run a specific query. Memory listed in this setting is noted in gigabytes (GB).
Because memory is a finite resource on the system, it usually best to start small when estimating the amount of memory needed to run the query, and then add more via this setting if needed.
Please contact your system administrator for further information about the memory capacity of your installation.
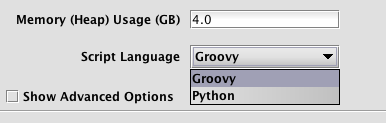
Script Language
Deephaven scripts can be written in Groovy or Python. The Script Language setting defaults to Groovy. If scripting in Python is desired, select Python from the drop-down menu.
Show Advanced Options
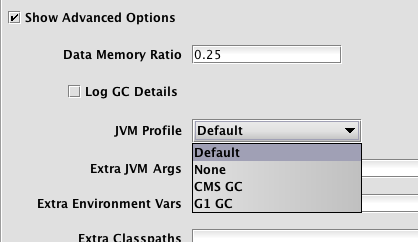
When Show Advanced Options is selected in the Persistent Query Configuration Editor window or Persistent Query Configuration Viewer window, the settings shown in the red outline below are revealed.
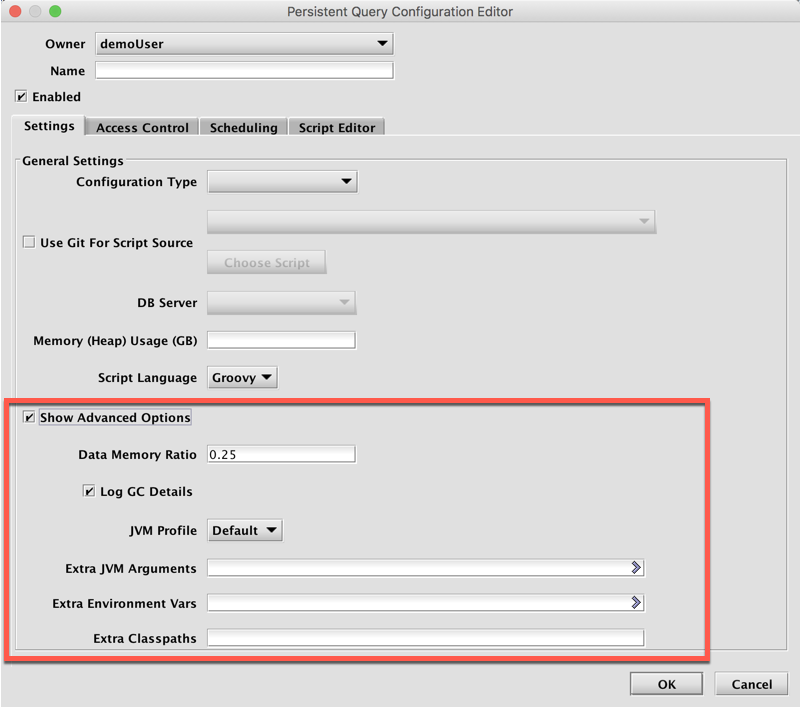
Data Memory Ratio - Data Memory Ratio is a memory tuning parameter that specifies what percent of the memory heap is reserved for caching data read from persistent storage. This enables Deephaven to cache data frames into RAM on an as-needed basis, which in turn speeds up the processing. The default value of ".25" in that field means 25% of the memory noted in the setting for Memory (Heap) Usage is allocated to the database buffer cache.
Log GC Details - Garbage Collection (GC) is a JVM memory management program that frees unreachable memory by getting rid of objects not being used by a Java application. When the check box is selected (the default setting), Garbage Collection information will be included in the server-side dispatcher logs.
JVM Profile - The Java Virtual Machine (JVM) contains a garbage collector to automatically free unreachable memory. There are multiple garbage collection algorithms, and many tuning parameters available for each algorithm. The JVM Profile drop-down menu provides the following four options:
- Default - use the default garbage collection parameters for your Deephaven system. This defaults to CMS GC, but the value can be changed by the Deephaven administrator.
- None - do not use any garbage collection parameters. Desired garbage collection parameters must be manually defined in the query's "Extra JVM Args" settings (see next topic).
- CMS GC - use Java's CMS (Concurrent Mark Sweep) garbage collection
- G1 GC - use Java's newer G1 (Garbage First) garbage collection
Extra JVM Arguments - This field allows users to access different Java utilities that are not included in core Deephaven installation. For example, one may want to run a different profiler or debugging processor. These items can be included in the Deephaven configuration by typing the extra JVM arguments in this field.
For another example, you can set certain scripts to be loaded every time you start your console by adding new values to IrisDbGroovySession.initScripts with the following argument:
IrisDbGroovySession.initScripts=ClientDbStrategies/groovy/core/core_utils.groovy:Research/groovy/user/my_analysis_utils.groovy
Note: clicking the right-facing arrow ( ) will open the field in a pop-out for easier editing.
Extra Environment Vars - Extra Environment Variables are used to pass additional configuration information to Deephaven. For example, the following variables direct Java to load shared libraries from /usr/lib/my-native-library, and change the query worker's log level to DEBUG.
JAVA_LIBRARY_PATH=/usr/lib/my-native-library REMOTE_QUERY_PROCESSOR_LOGLEVEL=DEBUG
Note: clicking the right-facing arrow () will open the field in a pop-out for easier editing.
Extra Classpaths
The Extra Classpaths field is used to tell Deephaven where to look on the filesystem (server) for additional class files. For example:
/usr/local/my-app/java_lib:/usr/lib/my-java-libs
Access Control
The next tab in the Persistent Query Configuration Viewer/Editor is Access Control.

As a query owner, you determine who can or cannot view or change your queries. This process is managed through the Access Control panel for each query.
To change the access control settings for a query, open the Query Configuration window and select the applicable query. Then select Edit from the list on the right, or right-click on the query name and select Edit Configuration. The Persistent Query Configuration Editor will appear. Click on the tab labeled Access Control.
The Access Control tab is where the query author can add specific authorization for other users or team members. This would be in addition to super-users and administrators, who have authorization to access all the queries in the system.
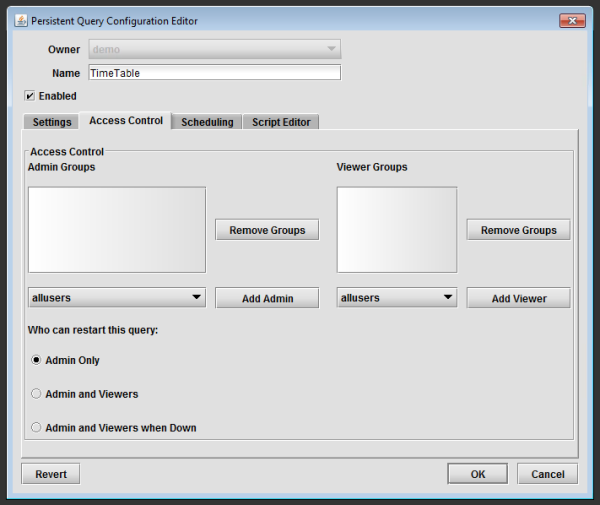
There are two fields in this tab, and each allows you to assign individuals or groups with access to your queries.
On left is the Admin Groups field. Individuals or groups listed in this field have full control of the query. Just like the query owner, they can edit, copy, revert, or delete the query, or start, stop, restart or disable the query. They can also view all the tables generated by the query, whether the table is filtered or not.
On the right side is the Viewer Groups field. Those listed in this field may view the name of the query in the Query Configuration window, but they will not be able to edit the query code nor start/stop the query. They may view tables generated by the query. However, if one or more of the table is filtered by the query code, viewers will only be able to view the filtered table(s).
To add a person or team to either group, click on the drop-down menu below the respective field and make your selection. Then click Add Admin or Add Viewer.
To remove a person or group, highlight their name in the field and click Remove Groups.
In the area at the bottom of this panel, you can assign permission to allow users to restart the query. The first two options enable restart by those in just the Admin Group, or those in either the Admin or Viewer groups. The third option enables restart by those in either group, but only if the query is not currently running.
Note: To restrict the viewing of Widgets in the console, please refer to: Setting Permissions for Viewing Plots.
Scheduling
The next tab in the Persistent Query Configuration Viewer/Editor is Scheduling.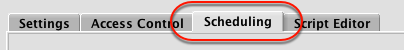
The Scheduling tab is where you set the conditions upon which the query will run.
When Live Query (Script), Live Query - Merge Server, or Live Query - Replay (ReplayScript) are selected as the Configuration Type, the first option presented in the Scheduling panel is Initialization Timeout.
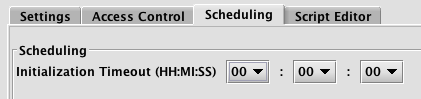
The Initialization Timeout setting enables you to set a period of time for this query to initialize before it times out. It defaults to zero, which means no timeout is enforced. You may want to change this setting if you want to limit the amount of time your query is allowed to spend initializing.
If Batch Query (RunAndDone) is selected as the Configuration Type, the first option presented in the Scheduling panel is Query Timeout.
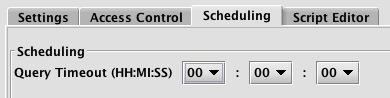
The Query Timeout setting enables you to set a period of time before the query times out; a batch query that executes for longer than this timeout is stopped. A setting of zero is not allowed, as a batch query must specify a maximum run time. You must select an appropriate value for this setting.
The next section in the panel allows you to set the schedule for your query and set the respective parameters based on the scheduling option chosen. These options include:
- Daily
- Monthly
- Dependent
- Temporary
- Continuous
- Disable Scheduling
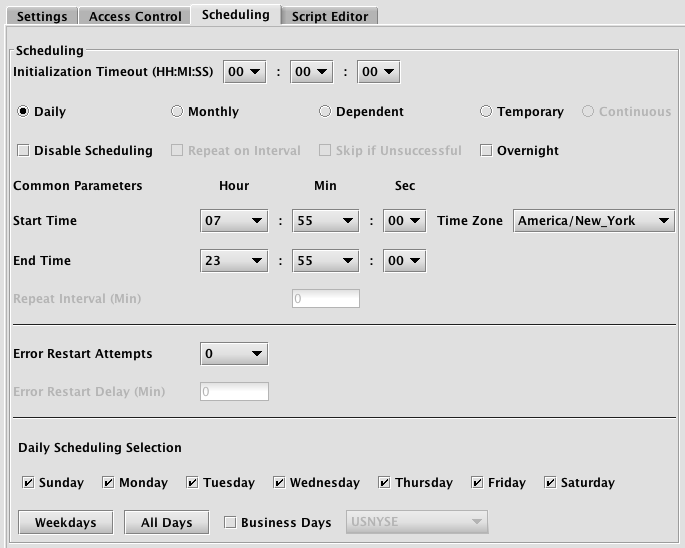
Daily
When Daily is selected, the lower part of the panel will show options for start and end times, and then individual check boxes for each day of the week. Or, you can select Weekdays, All Days, or Business Days. If Business Days is selected, the appropriate business calendar from the adjacent drop-down menu will also need to be selected.
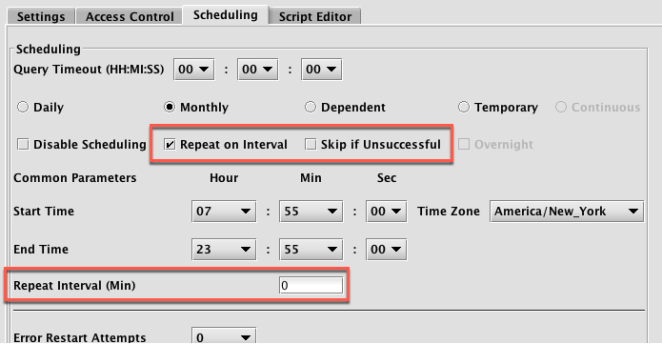
When Batch Query (RunAndDone) or Batch Query - Import Server is selected for the ConfigurationType, the Daily scheduling option also offers the Repeat on Interval option.
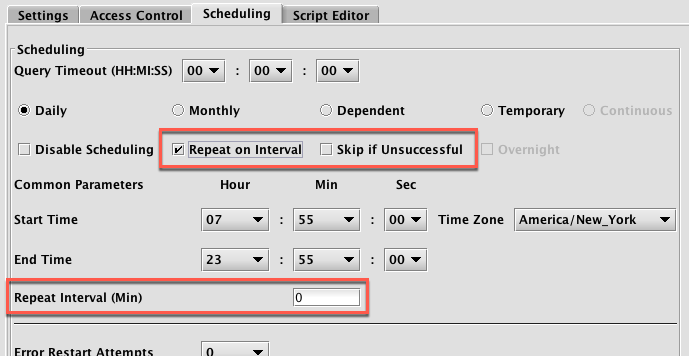
The Repeat on Interval setting enables you to set a timed interval (in minutes) for when the Batch Query (RunAndDone) or Batch Query - Import Server query should run again.
When Repeat on Interval is selected, the Skip if Unsuccessful option also appears. When selected, this tells Deephaven to skip the Repeat on Interval process if the Batch Query (RunAndDone) or Batch Query - Import Server query did not process completely.
Monthly
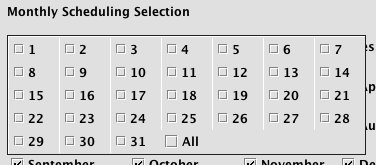
If you select Monthly, the lower part of the panel will show options for start and end times, and then present individual check boxes for each month. There are also options for Specific Days, First Business Day, and Last Business Day.
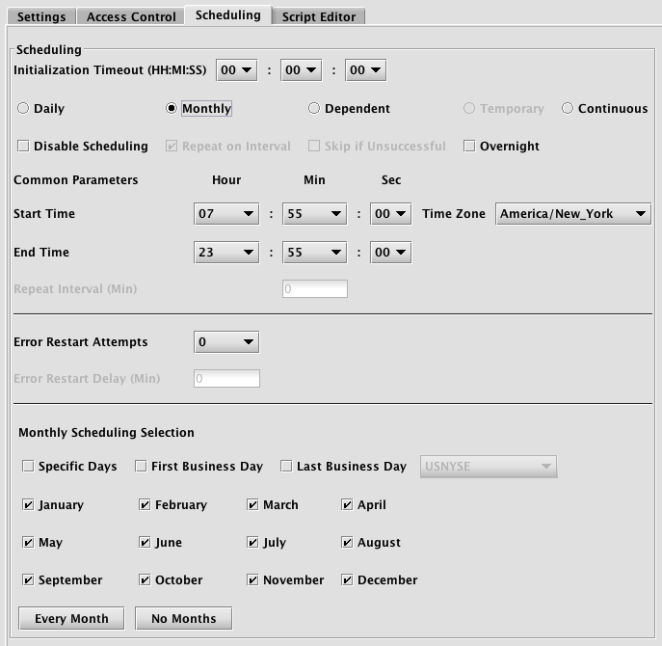
If you select Specific Days, a pop-up window will open, enabling you to select the day or days of the month on which you would like your query to run.
If you want the query to run only on the First Business Day or on the Last Business Day of a month, you would first select the appropriate check box, and then also select the applicable business calendar from the adjacent dropdown menu.
The Monthly subsection of the panel also includes two buttons at that bottom that enable you to more easily select Every Month or No Months.
When Batch Query (RunAndDone) or Batch Query - Import Server is selected for the ConfigurationType, the Monthly
scheduling option also offers the Repeat on Interval option.
The Repeat on Interval setting enables you to set a timed interval (in minutes) for when the Batch Query (RunAndDone) or Batch Query - Import Server query should run again.
When Repeat on Interval is selected, the Skip if Unsuccessful option also appears. When selected, this tells Deephaven to skip the Repeat on Interval process if the Batch Query (RunAndDone) or Batch Query - Import Server query did not process completely.
Dependent
Dependent scheduling means the running of this query is dependent upon another query. When Dependent is selected, the lower part of the panel will show an option to set the end time, and then present options for selecting the query and the conditions for which the dependent query should run.
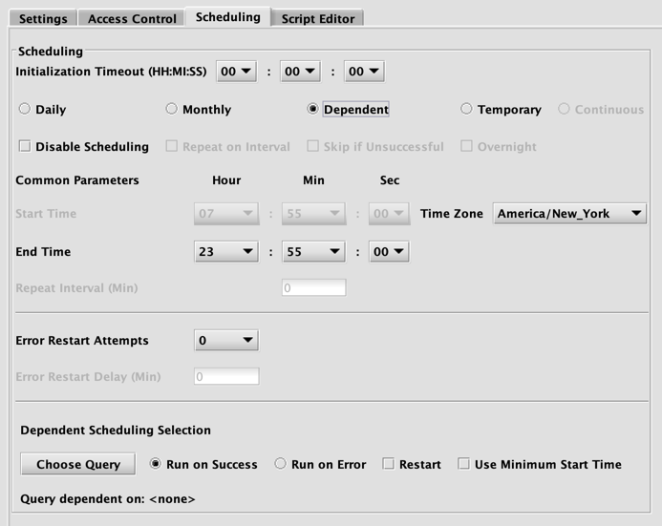
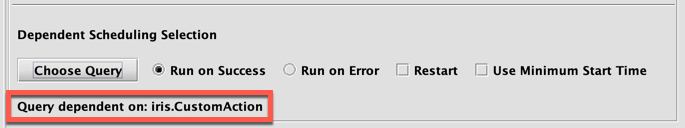
Select Choose Query to select the appropriate query. The name of the selected query will be added to the "Query dependent on:" statement. For example, the query named iris.CustomAction was selected for the following screenshot:
- Selecting the radio button for Run on Success means the dependent query will run only when the selected query has successfully completed.
- Selecting the radio button for Run on Error means the dependent query will run only if the selected query tries to run but fails.
- Selecting the Restart check box will restart the dependent query upon the selected trigger condition if it is already running.
-
Selecting the Use Minimum Start Time will re-enable the Start Time and Overnight options. The query will not start until its dependent condition is met AND the start time has passed. If Overnight is checked, the query will be scheduled the same way as a typical overnight query.
Temporary
A Temporary query is one that runs one time based on available resources and once completed, permanently deletes itself after a set time. These are especially useful when copying queries that import or merge data, as a temporary query can be defined to load data into a specific partition.
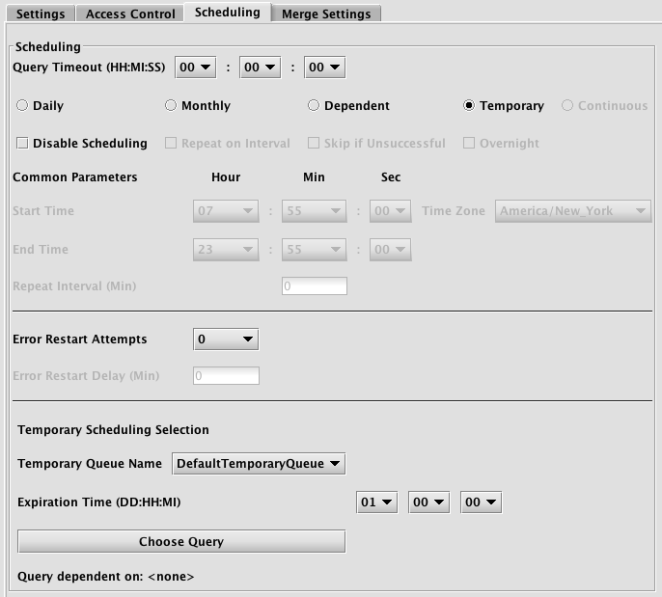
When Temporary is selected, the lower part of the panel will show an option to set the end time, and then present the following options:
- Temporary Queue Name is the name of the temporary queue that will run the query. Temporary queues are allocated by the system administrator and will run their queries when resources are available.
- Expiration Time is the length of time in days, hours and minutes before this query will delete itself once it has been run (whether the run was successful or not).
- Choose Query enables you to select a query to use as a dependency; which means that the query will only run after the chosen query completes successfully. The name of the selected query will be added to the "Query dependent on:" statement listed below the button. For example, this can be used to make a merge query dependent on its successful import query. A temporary query can only be dependent on another temporary query, not a query with another scheduling type.
Continuous
Continuous scheduling is an option for queries that would normally have an end time, such as Live Query (Script). With continuous scheduling, the query does not have a defined start and stop time, but is instead defined to run continuously, with an optional daily restart.
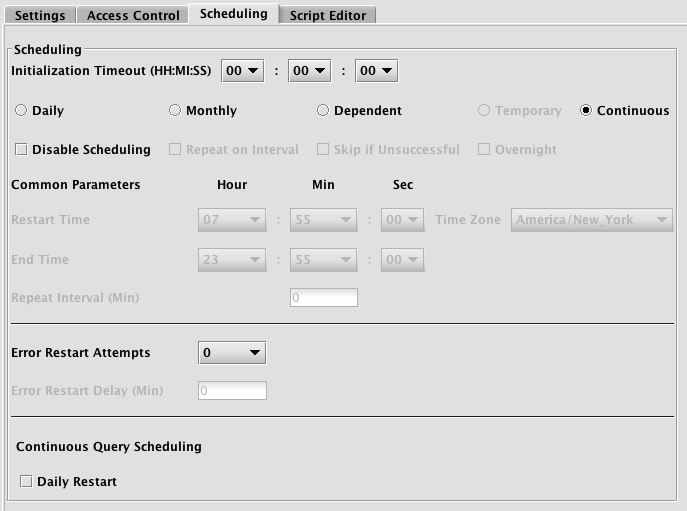
If the Daily Restart option is chosen, then a restart time must be selected. The query will be stopped and restarted at this time every day.
Disable Scheduling
When Disable Scheduling is selected, the rest of the options in this panel will become unselectable. You will then need to manually start and stop the query anytime you want it to run or stop running. The final options to set in this panel are the Start Time and End Time selections for the query. Simply choose the applicable hour, minute and second, and then the time zone to apply to those selections.
The start and end times default to 7:55 a.m. and 11:55 p.m. Eastern time respectively.
Overnight Scheduling
Overnight scheduling is an option for queries that require an end time and are scheduled to run Daily or Monthly.
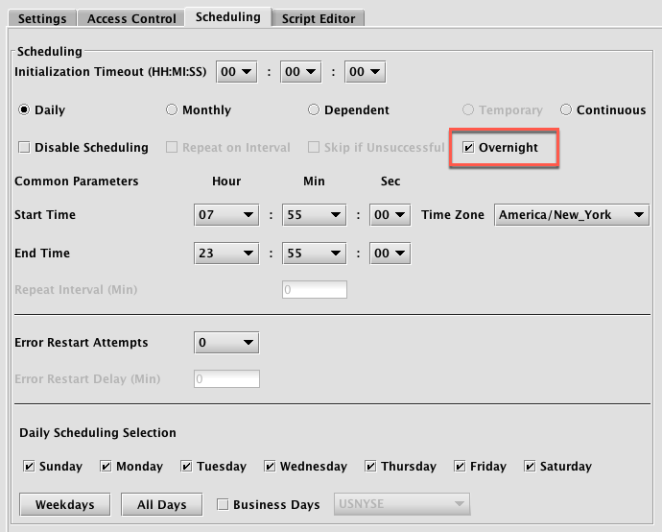
When Overnight is selected, the day(s) selected under Daily Scheduling Selection (days of the week or calendar days) apply to when the query starts. Also, the Start Time selected for the query must be later than the End Time.
For example, if an overnight query is scheduled to run on Monday and Tuesday from 17:00 - 16:00, the query would run on the following schedule every week:
- It will start Monday at 17:00
- It will stop Tuesday at 16:00
- It will start Tuesday at 17:00
- It will stop Wednesday at 16:00
When an overnight query is saved, an extra confirmation dialog is presented:
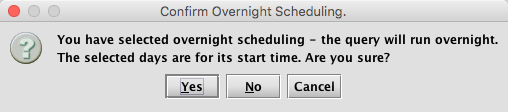
This can be turned off with the following console property: IrisConsole.showOvernightConfirmationDialog=false
Error Restart
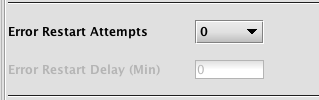
The "Error restart attempts" drop-down allows the query to automatically restart if it fails. An optional delay in minutes between restarts can be entered; if a query fails, the next restart attempt will be delayed by this time. The error count resets next time the query is started due to its scheduling, or 24 hours after the last failure.
If no delay is specified and a query has attempted to restart more than 10 times since the last time the error count was reset, the query will wait for a minute between retry attempts. This is to prevent a rapidly-failing query from consuming excessive system resources.
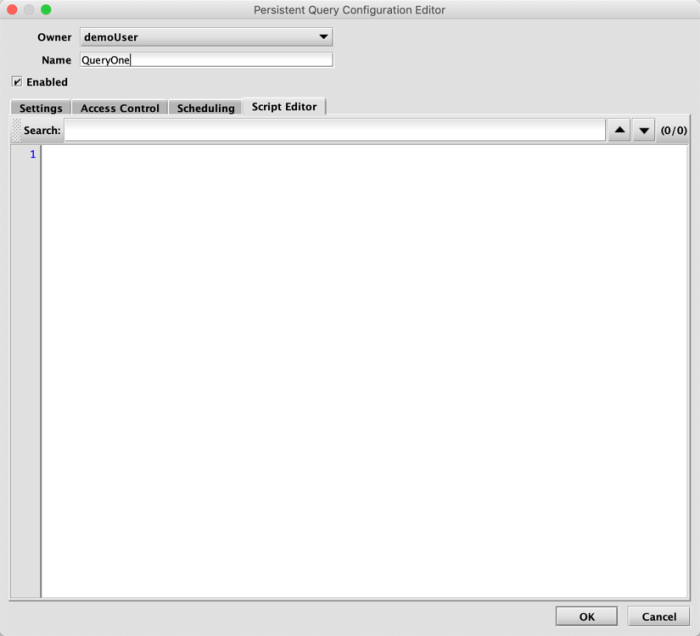
Script Editor
As shown below, clicking Script Editor will open an empty window where you can enter or potentially view the contents of your query. (Note: This tab is presented only when Live Query Replay - (ReplayScript), Batch Query (RunAndDone), Batch Query - Import Server or Live Query (Script) is selected as the Configuration Type.)
You can start from scratch and type your query script inside this window. However, users may choose to use other editors or development environments to create their queries, and then copy and paste the final scripts into this window.
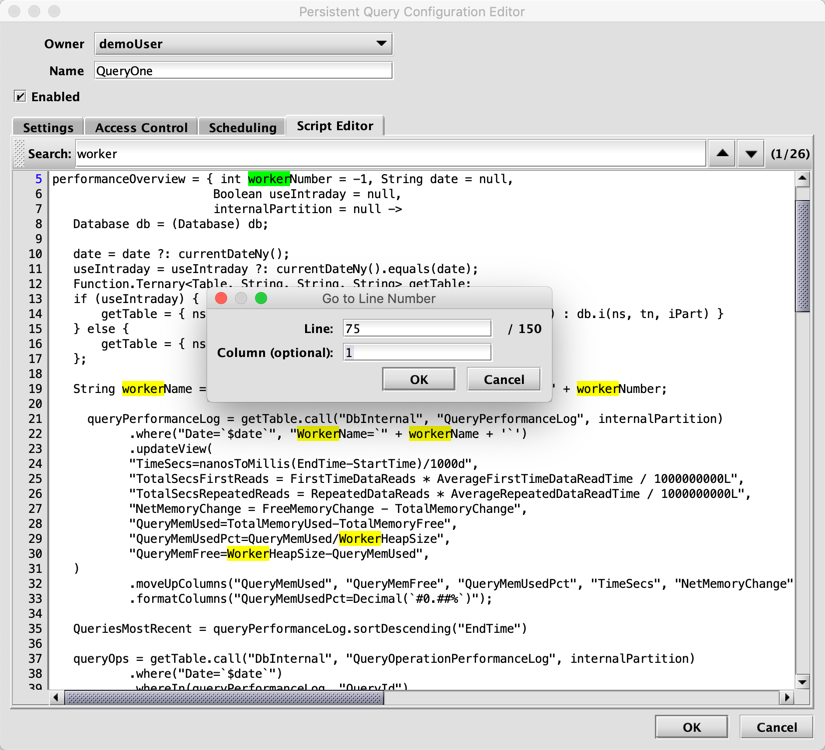
You can use the Search field to find and highlight any term in the script editor. Simply enter the applicable term or phrase in the Search field and press Enter/Return on your keyboard. The arrows at the right of the search bar scroll through each highlighted term: a green highlight indicates the term currently selected, and the yellow highlight indicates other instances of that term in the script. The Script Editor includes line numbers along the left side. You can quickly jump to any line number using the Go to Line Number feature, which can be accessed by right-clicking within the Script Editor, or using the keyboard shortcut, Ctrl+G or ⌘+G (macOS). The line number where you have placed your cursor will turn from black to blue.
Comment/Uncomment Content in the Script Editor
- Ctrl+/ (Windows); ⌘+/ (macOS): Comment out the selected lines. It will uncomment them if every line starts with a comment "
//". - Ctrl+Shift+/ (Windows); ⌘+Shift+/ (macOS): Create a block comment around the selected text. If a block comment is exactly selected from
/*to*/then it will uncomment the selected text.
Configuration
Creating a New Persistent Query
To create a new persistent query, open the Query Configuration window in Deephaven, and click on New on the right side of the window. This will open the Persistent Query Configuration Editor.
Your Deephaven username will be automatically listed as the owner of the query.
- The first tab shows the particular Settings for this query including the configuration, server, memory and more.
- The next tab shows the Access Control parameters, including the admin groups and the viewer groups.
- The third tab is labeled Scheduling, and allows you to schedule when a query should run.
- And finally, the tab labeled Script Preview allows you to see the query script itself.
When creating a new persistent query, you will need, at a minimum, to provide a query name, select the configuration type and the DB Server, and ascribe memory. The remaining query settings, features and scripting will vary, based on the type of analysis you want to run in this query.
When you have completed your new query, you can save your settings by clicking OK.
When you return to the Query Configuration tab, your new query will be listed.
If the Enabled setting was checked, and you are within the scheduled run time for the query, the query should be running. If the query was added outside of its scheduled run time, the query would start once the next scheduled run time period is reached.
Viewing Persistent Queries
To view an existing persistent query, open the Query Configuration window in Deephaven, and select the query you want to view. If you are authorized to view that particular query, you can then either click View, or right-click on the name of the query and select View Configuration. This will open the Persistent Query Configuration Viewer.
At the top of the window you can see the Query Owner and Query Name, and whether this query is currently enabled.
- The first tab shows the particular Settings for this query including the configuration, server, memory and more.
- The next tab shows the Access Control parameters, including the admin groups and the viewer groups.
- The third tab is labeled Scheduling, and allows you to schedule when a query should run.
- And finally, the tab labeled Script Preview allows you to see the query script itself.
When you are finished viewing this query, clicking OK or Cancel will return you to the Query Configuration Window.
Editing Persistent Queries
To edit a persistent query, open the Query Configuration window in Deephaven, and select the query you want to edit. If you are authorized to change that particular query, you can then either click Edit, or you can right-click on the name of the query and select Edit Configuration. This will open the Persistent Query Configuration Editor.
When you edit a persistent query, you have the same options to make changes as you did (or the author did) when the query was first created or previously edited.
For example, if your query requires more than the default amount of memory, then you can add more memory under Settings. Or, if you found a bug in the query script or needed to add more features to it, click on the tab labeled Script Preview and make whatever changes might be needed.
Once you are done making edits, click OK to save the changes you just made to this query.
If the query is running when you save it, it will be stopped. If the Enabled check box is not deselected during the editing process and the query is within its scheduled run time, it will restart as long as the edits are completed within the scheduled run period for this query. If the edits are saved outside of the scheduled run time, the query will restart at the next scheduled period.
Copying a Persistent Query
One may want to copy an existing persistent query to modify only a portion of the script for a slightly different analysis - all while keeping the original query intact. To copy an existing persistent query, open the Query Configuration window and select the query you want to copy. If you are authorized to change that particular query, you can then either click Copy on the right side of the window, or you can right-click on the name of the query and select Copy Configuration. This will open the Persistent Query Configuration Editor, where you can edit the parameters of this newly copied query.
After naming the new query, you can then edit aspects of the query as described in the Editing Queries section.
When you have completed your edits, click the OK button at the bottom to save the query. This will bring you back to the Query Configuration window, where your new persistent query can now be seen.
If the Enabled check box is selected during the editing process and the query is within its scheduled run time, the query will start as long as the edits are completed within the scheduled run period for this query. If the edits are saved outside of the scheduled run time, the query will restart at the next scheduled period.
Deleting Persistent Queries
To remove an existing persistent query, select the query you want to remove in the Query Configuration window. If you are authorized to change that particular query, you can then either click Delete, or you can right-click on the name of the query and select Remove Configuration. You will then be asked to confirm the removal of this query. If you click Yes, your query will be removed.
Reverting to a Previous Version of a Persistent Query
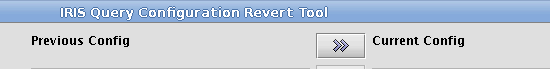
To revert to a previous version of a persistent query, open the Query Configuration window in Deephaven and select the query you want to revert. Then select Revert, or you can right-click on the query row and select Revert Configuration. The Query Configuration Revert Tool window will open.
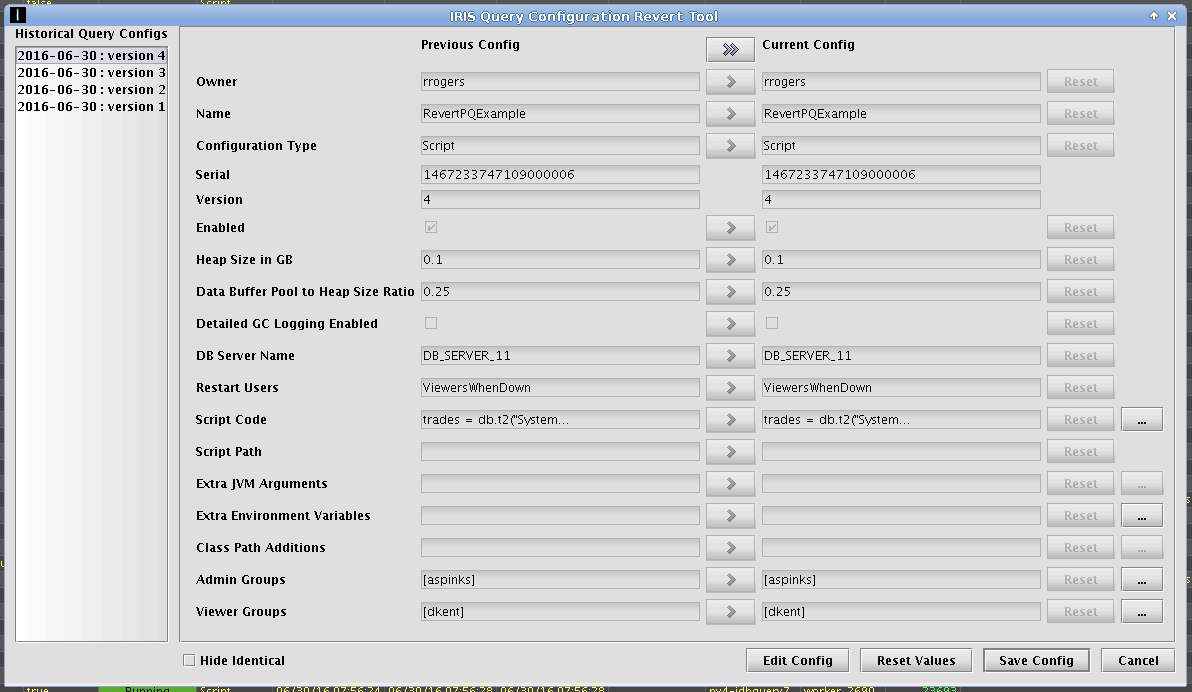
On the left, you will see a list of historical versions of this query. To the right, the parameters shown for both Previous Config settings and Current Config will be identical. To see the parameters for a previous version, select one from the historical list on the left.
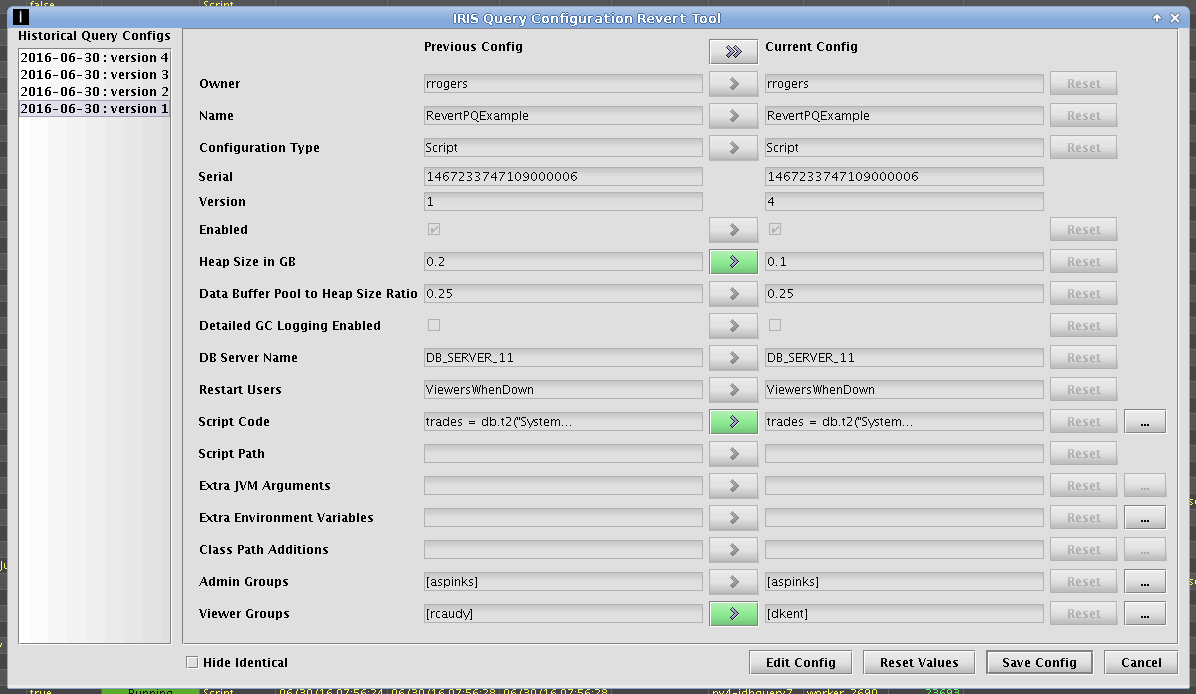
When "version 1" is selected from the list on the left, differences in parameters between the two versions will be highlighted by green buttons between the two columns. In this example, there are different parameters for Heap Size, Script Code and Viewer Groups.
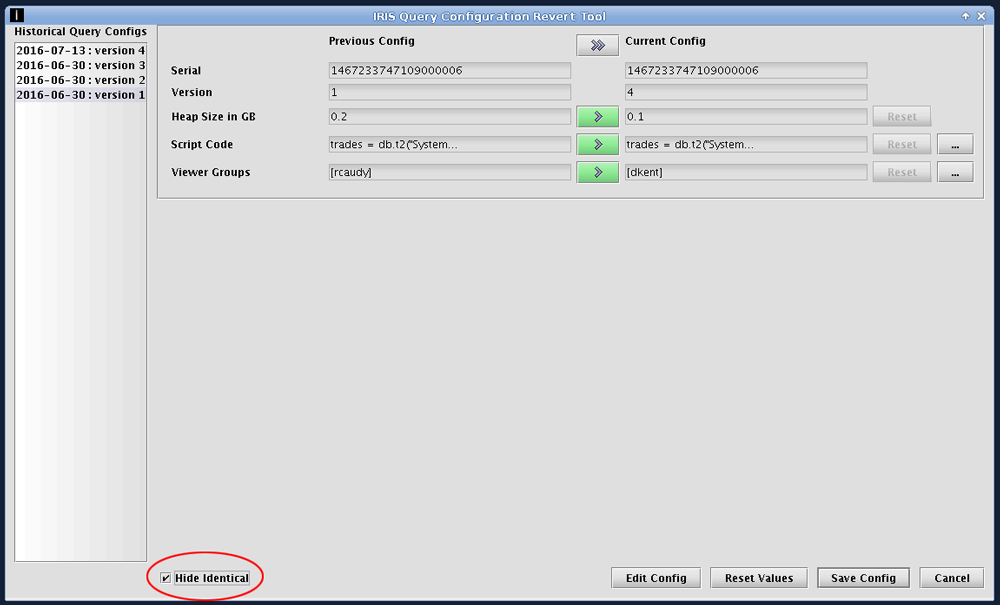
If you want Deephaven to display only those parameters that are different, click the Hide Identical check box at the bottom left corner of the window.
When possible, changes are noted in the parameter fields shown on the screen. In this example, the parameter for Heap Size changed from ".2" to ".1". Similarly, the parameter for Viewer Groups changed from "rcaudy" to "dkent".
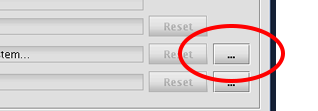
To see changes that are not visible within the specific parameter field, click the ellipsis button to the right of the current configuration parameter field.
In this example, clicking the ellipses button to the right of the field Script Code opens the Script Code Differences window as shown below.
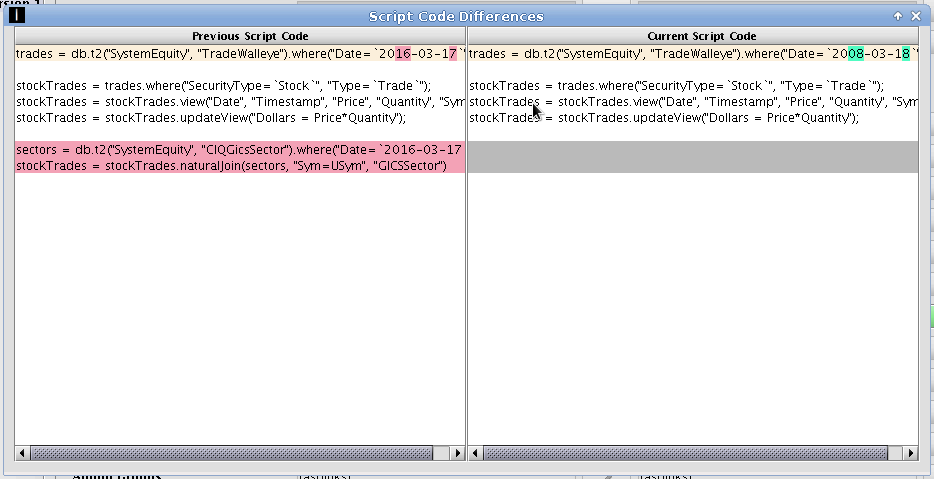
The Script Code Differences window presents the previous script on the left and the current script on the right. For easy comparison, differences are highlighted in red for the previous version and in green for the current version. Entire lines that were added or removed are highlighted in gray on the opposite panel. You cannot edit from this panel, but you can copy content into the clipboard from either side of the panel.
Differences in array fields, like the Admin Groups field, are delineated with brackets ([ ]), and only the first array element is shown. If more than one array element exists in the field, the full fields for both the previous and current fields can be viewed by clicking on the ellipses button.
The Query Configuration Revert Tool window offers two ways to revert to parameters used in previous queries.
If you only want to revert one parameter, click the green button for the specific parameter you want to revert. For example, if you want to copy the previous Heap Size into the new configuration, click the green highlighted button between those two fields.

If you would like to revert the entire set of parameters from a previous query into the current configuration, click on the button at the top of the panel as shown below.
Whether you revert the parameters one at a time or all at once, the values will be copied to the Current Configuration side of the panel, and highlighted in orange. Also, the Reset button will appear. If you would like to cancel the reversion for a specific parameter, click Reset.

Once you are satisfied with the parameters you reverted, click Save Config. This will save a new version of the query. If the query remains enabled and all changes are saved within its scheduled run time, the query will restart. If the changes are saved outside of the scheduled run time, the query will restart at the next scheduled period.
Clicking Edit Config opens the Persistent Query Configuration Editor, where you could make additional changes.
Clicking Reset Values clears all changes made during this session and leaves the window open. This is effectively the same as clicking all the green reset buttons at once.
Finally, clicking Cancel closes the window without saving any changes.

Administration Panel
Options in the Administration section of the Query Configuration window include the following:
- Stop
- Start (or Restart)
- Disable
- Enable
![]() Note: The administrative options presented apply only if you have the appropriate privileges for the query.
Note: The administrative options presented apply only if you have the appropriate privileges for the query.
Stopping Persistent Queries
If the query is running, selecting Stop from the Query Configuration window (or from the shortcut menu) will generate a confirmation window to ensure you want to stop the query. The query will stop after clicking OK. Multiple queries can be stopped at one time with this option.
If none of the selected queries are running, the Stop option will be grayed out.
Starting (or Restarting) Persistent Queries
If a query is enabled but not running, selecting Start from the Query Configuration window (or from the shortcut menu) will generate a confirmation window to ensure you want to start the query. The query will start after clicking OK. If the query is already running, selecting Restart from the Query Configuration window or from the shortcut menu will cause the query to stop and then restart (after confirmation).
If multiple queries are selected, and some of the queries are enabled, clicking Start (or Restart) will generate a confirmation window. If one or more of the queries selected have specific start/stop schedules, and it is outside of a query's schedule runtime, the confirmation window will provide separate options for restarting all queries, or restarting only those queries that are currently within their scheduled runtime. Only enabled queries will be started or restarted if multiple queries are selected.
If none of the selected queries are enabled, the Start option will be grayed out. See: Scheduling Persistent Queries.
Disabling Persistent Queries
Selecting Disable from the Query Configuration window (or from the shortcut menu) will disable the selected queries from further operation until it is been enabled. If the queries are running when Disable is selected, the query will first be stopped and then disabled.
If all of the selected queries are already disabled, the Disable option will be grayed out.
Enabling Persistent Queries
Selecting Enable from the Query Configuration window (or from the shortcut menu) generates a confirmation window to ensure you want to enable the queries. Clicking OK allows the queries to start and run during their next scheduled runtime. If the queries are unscheduled (no start/stop time specified) they will start running immediately. See: Scheduling Persistent Queries.
A query must be enabled for it to run.
If all selected queries are already enabled and/or already running, the Enable option will be grayed out.
Force Starting (Force Restarting) a Persistent Query
The Force Start (or Force Restart) option is only available from the shortcut menu. Selecting this option will force a query to stop and then restart.
If multiple queries are selected, and all of the queries are enabled, clicking Force Start (or Force Restart) will generate a confirmation window that will list all of the queries selected. Clicking OK, will result in all of the queries being restarted, regardless of the scheduled runtime for any of the queries.
Accessing Tables and Plots Created by Persistent Queries
Tables and plots (widgets) created by console-based queries are generated immediately after the query is triggered. However, tables and plots generated by persistent queries need to be selected manually to appear in the Deephaven console.
Accessing Tables Created by Persistent Queries
To see a table associated with a particular query, open the Query Configuration window and select the name of the query. In the example shown below, "QueryOne" was highlighted by clicking anywhere in that row.
To see the table(s) associated with that query, click on the drop-down list to the right of the Show Table button (see below). This drop-down menu includes, in alphabetical order, the name of every table associated with the query highlighted.
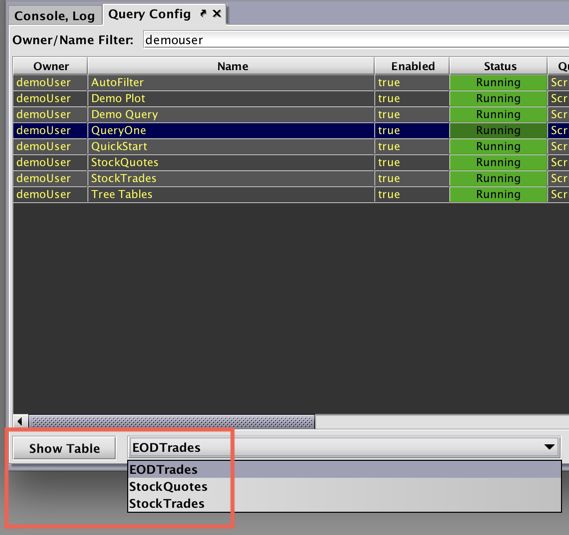
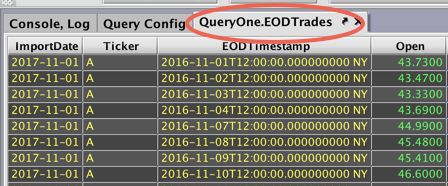
In this example, "EODTrades" is the table we want to see so we can select "EODTrades" in the drop-down menu, and click Show Table. A new tab will appear at the top of the interface titled, "QueryOne.EODTrades", as shown below.
Let's say we open the "StockTrades" table instead, and are met with this error:
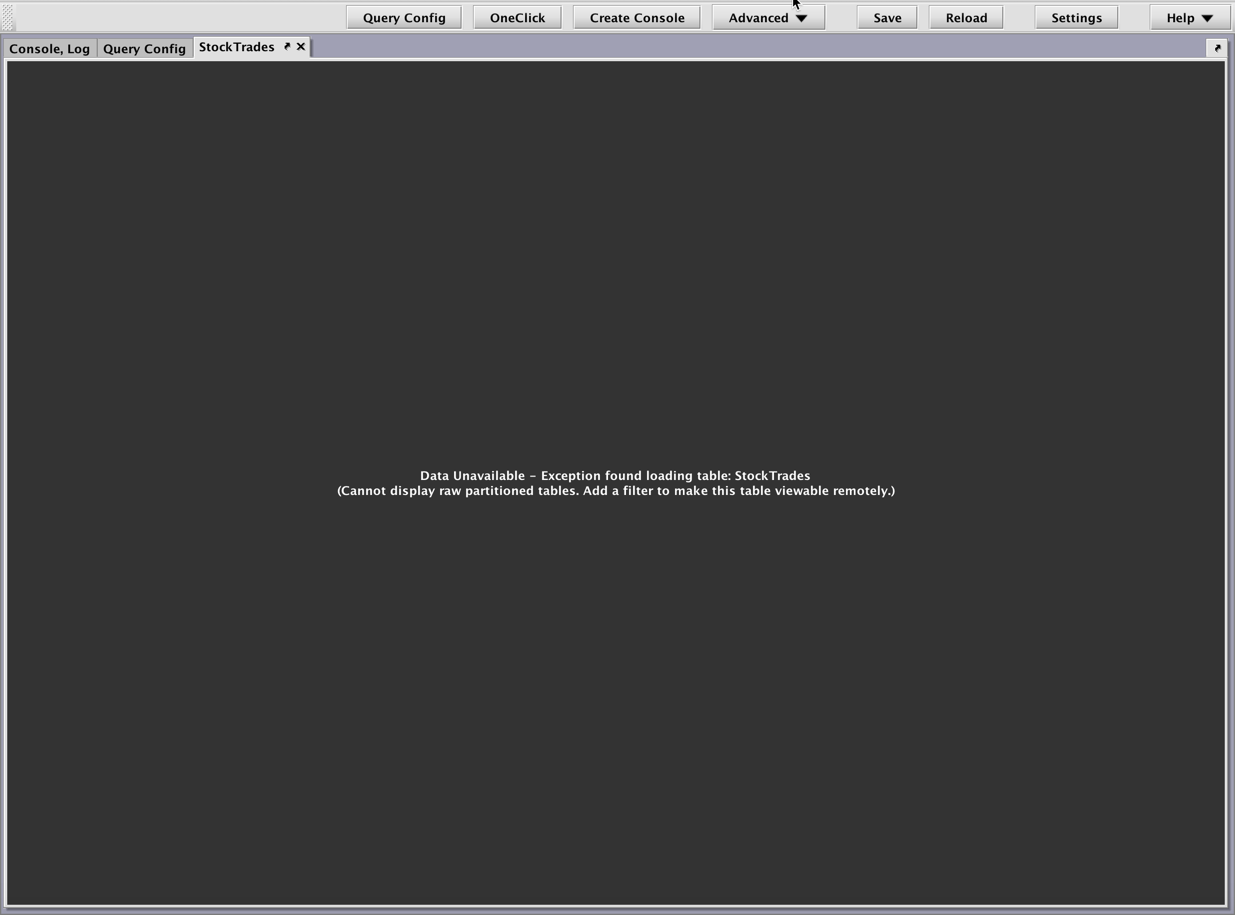
The console will not open a table that does not have one or more partitions specified. If we open the script editor, we will see that StockTrades=db.t("LearnDeephaven" , "StockTrades"). You must include a filter in the persistent query, such as either of the following:
StockTrades=db.t("LearnDeephaven" , "StockTrades").where()
StockTrades=db.t("LearnDeephaven" , "StockTrades").where("Date=`2017-08-24`")
See also: Working with Tables.
Accessing Plots (Widgets) Created by Persistent Queries
To see a plot (widget) associated with a query, open the Query Configuration window and select the name of the query. In the example shown below, "Demo-Plots" was highlighted by clicking anywhere in that row. To see the plot(s) associated with that query, click on the drop-down list to the right of the Show Widget button. This drop-down menu includes, in alphabetical order, the name of every plot associated with the highlighted query.
In this case, there are eight plots listed. To view a specific plot, select its name in the drop-down menu, and click Show Widget.
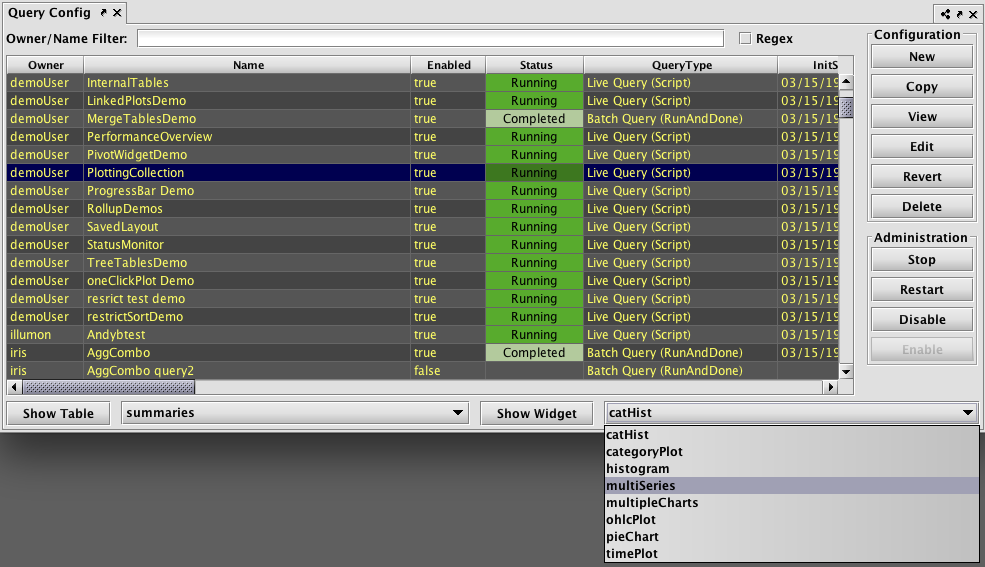
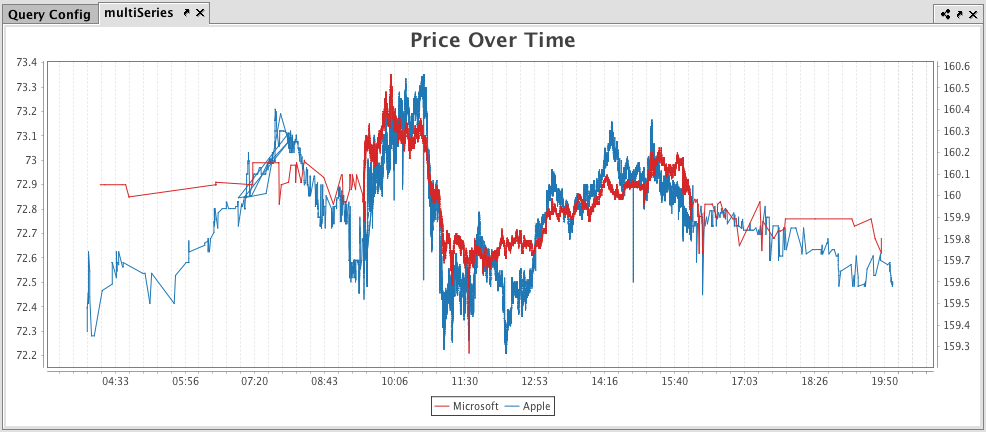
A new tab will appear at the top of the interface to hold the new widget. In this case, the tab was titled, "multiSeries", as shown below:
See also: Working with Plots and Plotting
Last Updated: 16 February 2021 18:07 -04:00 UTC Deephaven v.1.20200928 (See other versions)
Deephaven Documentation Copyright 2016-2020 Deephaven Data Labs, LLC All Rights Reserved