The Console
The Deephaven Console is one of the options used to write queries for data analyses. Console-based queries differ from persistent queries, which can be saved, thereby enabling the automation of repetitive and/or timed operations. Also, persistent queries can be easily shared with other individuals or teams.
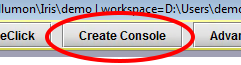
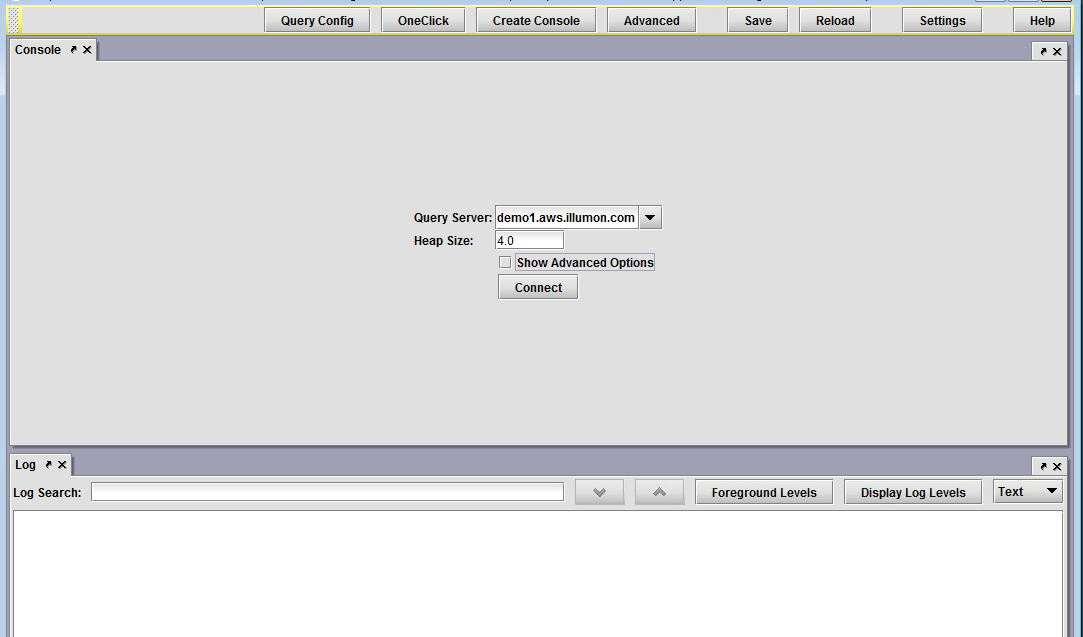
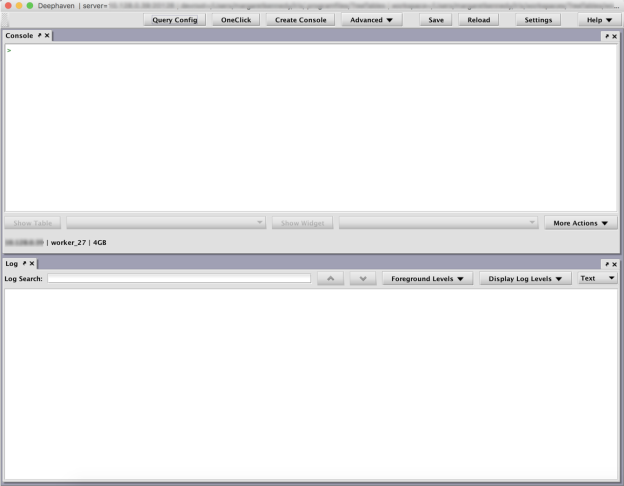
To access the console, open Deephaven and then click Create Console. You will then be given the opportunity to rename the new console panel. After clicking OK, a new panel will open with a Console window at the top and the Log window at the bottom, as shown below.
Console Window
In the Console window, you will be presented with options to specify the Query Server you want to use and the Heap Size (memory size) requested to run the query.
Query Server
This setting will default to the primary server in your installation of Deephaven, or the previously used server. If other servers are available and you are authorized to access them, they will be presented in the drop-down menu. Because every installation is unique, please consult your system administrator for additional information about the query server.
Heap Size
This setting refers to the dynamic memory (RAM) you want Deephaven to use to process the instructions and the data needed to run this specific query. Memory listed in this setting is noted in gigabytes (GB).
Because memory is a finite resource on the system, it usually best to start small when estimating the amount of memory needed to run the query, and then add more via this setting if needed.
Please contact your system administrator for further information about the memory capacity of your installation.
Session Type
Deephaven scripts can be written in Groovy or Python. This setting defaults to Groovy. If scripting in Python is desired, select Python from the drop-down menu. The default System Python environment will be used, unless otherwise specified. However, a given Python environment can be specified for use by providing extra JVM arguments, as laid out in Installing Python > JPY JVM Flags.
Show Advanced Options
If you select the Show Advanced Options check box, additional setting options will appear in the console panel, as shown in the following image:
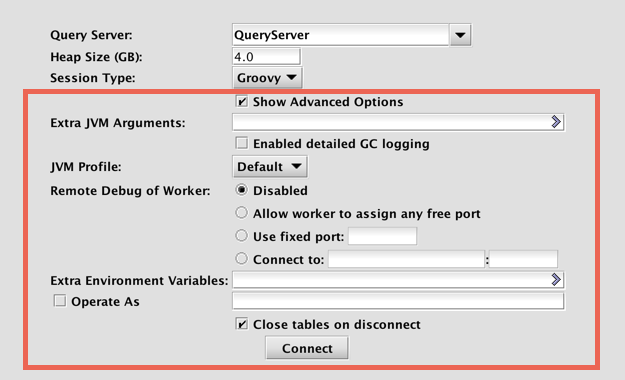
- Extra JVM Arguments - This field allows users to access different Java utilities that are not included in core Deephaven installation. For example, one may want to run a different profiler or debugging processor. These items can be included in the Deephaven configuration by typing the extra JVM arguments in this field.
For another example, you can set certain scripts to be loaded every time you start your console by adding new values to
IrisDbGroovySession.initScriptswith the following argument:IrisDbGroovySession.initScripts=ClientDbStrategies/groovy/core/core_utils.groovy:Research/groovy/user/my_analysis_utils.groovy
Note: clicking the right-facing arrow (
) will open the field in a pop-out for easier editing.
JVM Profile - This drop-down field allows users to select an alternative profile for new persistent queries. Remote processing profiles are used to specify JVM parameters and environment variables for persistent queries and interactive consoles. Several predefined profiles are available, such as CMS GC or G1 GC, and new ones can be defined using controller properties.
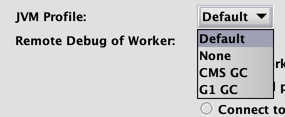
To learn more, see Remote Processing Profiles in the System Administration Guide.
- Enabled detailed GC logging - Garbage Collection (GC) is a JVM memory management program that frees unreachable memory by getting rid of objects not being used by a Java application. When the check box is selected, Garbage Collection information will be included in the server-side dispatcher logs.
- Remote Debug of Worker
- A debugger is a program that lets you step through your code one line at a time so you can detect errors. Options to implement the debugging program are provided as radio buttons below this heading, and include the following:
Disabled
Allow worker to use any free port
Use fixed port:
Connect to:
When debugging is enabled, you can connect to the worker with a debugger. Alternatively, the worker can be connected to your IDE to initiate debugging. You may use a JDWP debugger of your choice, such as JetBrains IntelliJ.
- Extra Environment Variables - Extra Environment Variables are used to pass additional configuration information to Deephaven. For example, the following variables direct Java to load shared libraries from
/usr/lib/my-native-library, and change the query worker's log level toDEBUG.
JAVA_LIBRARY_PATH=/usr/lib/my-native-library REMOTE_QUERY_PROCESSOR_LOGLEVEL=DEBUG
Note: clicking the right-facing arrow (
- Operate As - If the check box is selected, this allows system administrators (and other authorized users) to run the console as a specific user.
- Close tables on disconnect - If the check box is selected, all tables created in this console will be closed when the console is disconnected. If the check box is not selected, tables and charts created by that instance of the console will not be closed. However there will not be any data displayed in the tables/widgets.
After adjusting the applicable settings in the dialog box, click Connect.
The Console window is now ready for your query. Simply click anywhere in the Console type your query.
Up to three buttons are available at the bottom of the Console window:
Show Table
Clicking Show Table enables users to open any tables associated with this instance of the console.
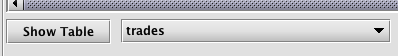
When a query executed in the console creates a new table, that table is immediately presented in the lower panel. The name of that table will also be added to the drop-down menu to the right of the Show Table button. If you close a table in the console and then decide you want to reopen it, select the name of the table from the drop-down menu and then click Show Table. You can also use Show Table to create multiple copies of the table in the console.
Show Widget
If a query creates a widget in the console, the Show Widget button becomes enabled.
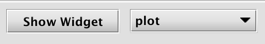
Clicking Show Widget enables users to open any widgets associated with this instance of the console. (Note: "Widget" is a term used to describe various user interface components. In Deephaven, a plot is a common form of widget.)
When a query executed in the console creates a new plot (widget), that plot is immediately presented in the lower panel. The name of that plot will also be added to the drop-down menu to the right of the Show Widget button. If you close a plot in the console and then decide you want to reopen it, select the name of the plot from the drop-down menu and then click Show Widget. You can also use Show Widget to create multiple copies of the plot in the console.
More Actions
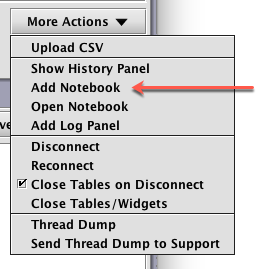
Clicking More Actions presents the following options in a drop-down menu
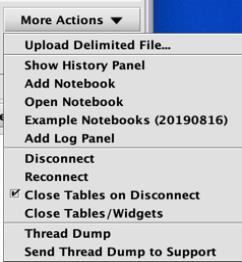
- Upload Delimited File... enables the user to upload a CSV to Deephaven. Multiple delimited-type files can be imported, including Comma, Tab, and Pipe delimited options:
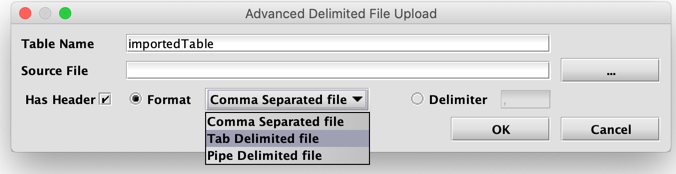
However, any single character can actually be used by typing it into the "Delimiter" box. - Show (or Close) History Panel reveals a partition on the right side of the console window, which show a list of commands used previously in the console. See: History Panel for more information.
- Add Notebook opens a Notebook panel in the console, which can be used to develop query components, stage draft queries, or simply store notes. See: The Notebook for more information.
- Open Notebook enables users to select and open previously saved notebooks. See: The Notebook for more information.
- Add Log Panel will create a new log panel if you have closed the log panel for this console.
- Disconnect enables the user to disconnect from the server without quitting Deephaven altogether
- Reconnect enables the user to reconnect to the server without having to restart the entire application.
- When selected, Close Tables on Disconnect closes all tables when Deephaven becomes disconnected from the server.
- Close Tables/Widgets closes all tables and widgets generated by this instance of the console.
- Thread Dump is an option most often used by Deephaven power users and programmers, as well as support. Similar to a stack trace, the thread dump shows a snapshot of the current state of threads running in the application, and can be useful when troubleshooting unexpected behavior.
- Send Thread Dump to Support provides users with the option of sending the thread dump to Deephaven Support. (See: Getting Help)
Console Keyboard Shortcuts
When writing queries in a Deephaven console window, it is common to reuse previously entered commands. For example, the "up arrow" key can be used to retrieve and reuse commands entered in the past. Pressing the Ctrl-R / Control-R key combo enables a search for a previously used command. The console and Notebook panels support the following keyboard shortcuts to make editing a bit faster, including a mix of Emacs keys and others. Default Java keys may also work.
|
Windows |
MacOS |
Action |
|---|---|---|
|
Alt+Backspace |
Control+Backspace |
Deletes the word before the cursor |
|
Alt+B |
Control+B |
Moves back a word, starting at your cursor |
|
Alt+D |
Control+D |
Deletes the word starting at your cursor |
|
Alt+F |
Control+F |
Moves forward a word, starting at your cursor |
|
Ctrl+A |
⌘+A |
Selects the entire command. On a Window-based workstation, if your command is already selected, Ctrl-A selects the entire console. On a MacOS-based workstation, Command-A always selects the entire console. |
|
Ctrl+C |
⌘+C |
Copies commands only from the Console. To copy all text (including prompts), right-click the selection and select Copy. |
|
Ctrl+E / End |
Control+E / End |
Goes to end of the line (as with END) |
|
Ctrl+F |
⌘+F |
Opens the search bar in any table. |
|
Ctrl+G / ESC |
Control+G / ESC |
Kills the entire line |
|
Ctrl+K |
Control+K |
Deletes all text from the cursor to the end of the line |
|
Ctrl+R |
Control+R |
Starts the reverse command history search, and moves back one command |
|
Ctrl+S |
Control+S |
When used in reverse command history search, this moves forward one command |
|
Ctrl+W |
⌘+W |
Selects the current word |
|
Ctrl+Y |
⌘+Y |
Redoes the undone previous action(s) |
|
Ctrl+Z |
⌘+Z |
Undoes the previous action(s) |
|
Ctrl+Shift+Z |
⌘+Shft+Z |
Redoes the undone previous action(s) |
History Panel
The Deephaven History panel is used to review, retrieve and rerun queries that were used in previous queries. The History panel can be accessed two ways:
- With a console window open, click More Actions. In the drop-down menu that appears, select Show History Panel.
- Right-click inside the console window and select Show History Panel in the menu.
When visible, the History panel always appears to the right of the console window, as shown below.
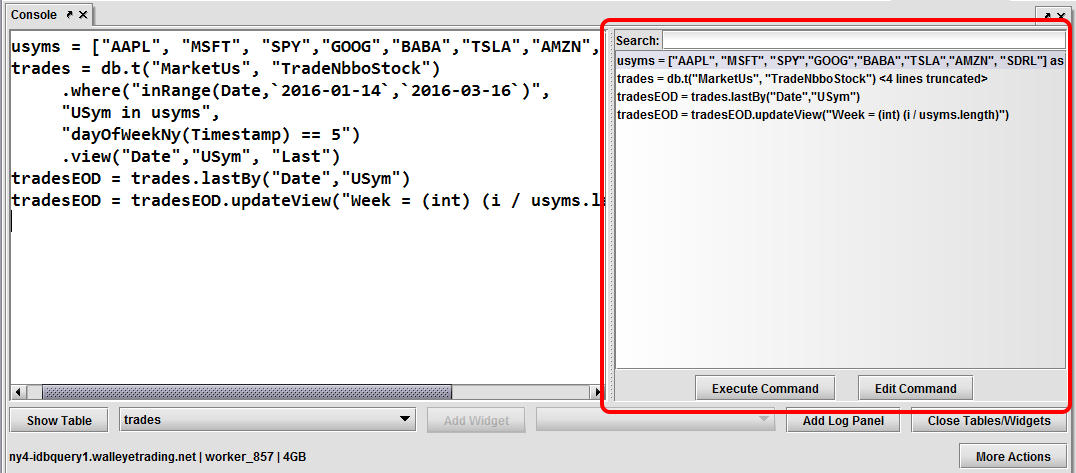
The most recently used commands are shown at the bottom of the list. When the panel is full of previous commands, scrolling enables users to find older commands.
When a multi-line command is used in the console window, only the first line of the command is presented in the History panel. The key combinations of Ctrl+Up/Down (Windows); ⌘+Up Arrow/Down Arrow (macOS) can be used to cycle through multi-line commands in the History panel.
You can highlight a command in the History panel by clicking once on the command. If you double-click on a command in the panel, that command will be copied to the console.
The "Search" field at the top of the History panel can be used to find a specific keyword in a previous command.
If you highlight a command in the History panel and then click Execute Command, that command will be copied to the console panel and immediately executed.
If you highlight a command in the History panel and then click Edit Command, that command will be copied to the console window, where you can further edit the command as needed.
If you right-click on a command in the History panel, the following options are presented:
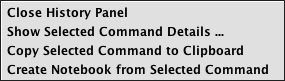
- Close History Panel: When selected, the History panel closes.
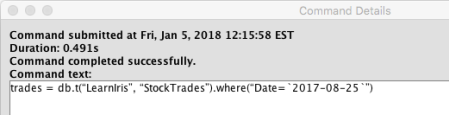
- Show Selected Command Details...: When selected, the entire command will open in a new window. This is especially useful for reviewing a multi-line command. See example below.
- Copy Selected Command to Clipboard: When selected, the command highlighted will be copied to the clipboard.
- Create Notebook from Selected Command: When selected, the command highlighted will be copied to a new Notebook panel. (More information on the Notebook is presented below.)
Using Notebooks
The Notebook is a feature in which users can develop query components, stage draft queries, or simply store notes. The Notebook can be used as a "sandbox" in which queries can be developed and refined, whereas the Deephaven Console is ultimately where queries are executed.
To open the Notebook feature, a Deephaven Console must be open and connected to a server. Once the Console is connected, the Notebook can be added to the user interface by clicking the More Actions button on the lower right corner of the Console window, and then selecting Add Notebook from the drop-down menu. See below:
Once selected, the Notebook window will appear in its own tabbed panel below the Console window, as shown below:
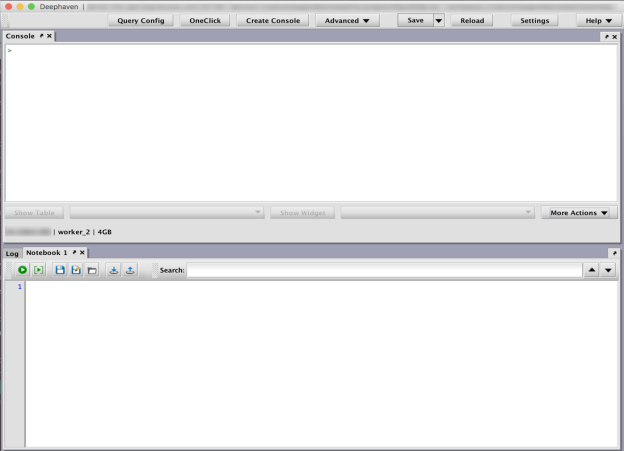
The Notebook is now ready for use.
Notebook Toolbar
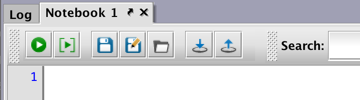
Content entered in the Notebook panel can be acted upon by using the buttons in the Notebook Toolbar, as described below.
 Run Notebook - This option automatically copies all of the content in the Notebook window, and then executes the content in the Console. This action can also be triggered with the following keyboard shortcut: Ctrl+Alt+R (Windows); ⌘+Option+R (MacOS).
 Run Selected Lines - This option copies the content you have highlighted in the Notebook window and then executes those selected lines in the Console. This option runs the entire selected line (or lines), even if you have highlighted only a portion of the line. This action can also be triggered with the following keyboard shortcut: Ctrl+Enter (Windows); ⌘+Enter (MacOS).
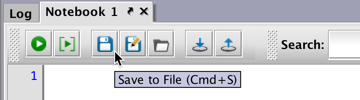
 Save - This option saves all of the content of the Notebook to a file on the user's system. When Save is clicked for the first time, the Save dialog window prompts the user to enter a filename and select the file location. Depending upon the content in the Notebook, the file is saved as .txt, Groovy or Python filetype. Clicking Save again overwrites the existing file with the current Notebook content. After the file is saved, the name shown on the Notebook tab changes to match the filename used during the Save process. Note: Notebooks with unsaved changes include an asterisk (*) in the panel tab.
 Save As - This option enables the user to save all of the content of a Notebook into a new file and/or to a new location on the user's system. In essence, it is the same as clicking Save for the first time. However, it can also be used to save previously saved Notebooks with a different name or to a different location. When selected, the user is prompted to enter a filename and select the file location. After the file is saved, the name shown on the Notebook tab changes to match the filename used during the Save process.
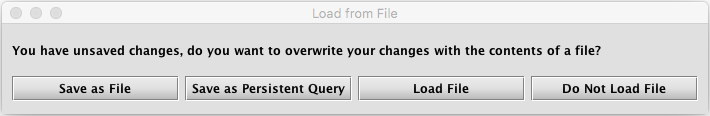
 Open - This option enables the user to open a .txt, Groovy or Python file on his/her system. Once a file is selected, the content of that file is copied into the Notebook panel, and will replace the previous content (if any) in the Notebook. If there is unsaved content in the existing notebook, the following dialog box will prompt you for a decision:
Note: A collection of pre-made Notebook files is available for download. See: Example Notebooks.
 Save to Persistent Query - This option enables the user to save the content of the Notebook to a persistent query. When clicked, the Save to Persistent Query dialog window prompts the user to select whether to save the content to a New Persistent Query or to update an Existing Persistent Query.
- If Create New Persistent Query is selected, the Persistent Query Configuration Editor window will open and prompt the user for additional information. The entire contents of the Notebook will be copied to the Script Editor for this persistent query, and can be further edited if desired. Once the persistent query is saved, the name shown on the Notebook tab will change to match the name of the persistent query. Moreover, if the script was edited further in the Script Editor, the most recent version of the script will be shown in the Notebook. However, the original Notebook may be reopened to retrieve any of the original content that may have been overwritten.
- If Update Existing Persistent Query is selected, the user will then need to select the name of the existing persistent query in Deephaven that should be updated. When OK is selected, the content of the Notebook will completely replace the content found in the existing persistent query selected. After the file is saved, the name shown on the Notebook tab will change to match the name of the persistent query used during the Save process. This feature works with persistent query scripts that are sourced from within Deephaven. Scripts sourced outside of Deephaven (e.g., Git, etc.) will not be updated.
 Load from Persistent Query - This option enables the user to extract the contents of an existing persistent query in Deephaven and load it into the Notebook window. When selected, the Load from Persistent Query dialog window will open, and show a list of the persistent queries for which you are an authorized editor. After you select the desired persistent query and click OK, the previous contents of the Notebook (if any) will be replaced with the script from the selected persistent query. The name of the Notebook tab will also change to match the name of the persistent query selected. If the Notebook contains unsaved content when you select Load from Persistent Query, you will be prompted for a decision to handle the unsaved content. This feature works with persistent query scripts that are sourced from within Deephaven. Scripts sourced outside of Deephaven (e.g., Git, etc.) will not be loaded.
Search - Entering a value in the Search field will enable you to search for that value in the Notebook. When a searched value is found in the Notebook, the value will be highlighted. The up and down arrows to the right of the Search field enable users to move forward and backward in Search history.
Hovering over the buttons in the Notebook toolbar will show the name of the function and the corresponding keyboard shortcut to execute the function (when available). An example is shown below.
Other commands include the following:
- Run Selected Notebook: Ctrl+Alt+R (Windows); ⌘+Alt + R (macOS)
- Run Selected Lines: Ctrl+Enter (Windows); ⌘+Enter (macOS)
- Save to File: Ctrl+S (Windows); ⌘+S (macOS)
Notebook Right-click Options
In addition to the tools in the Notebook Toolbar, additional options are presented when you right-click in the Notebook window. The options presented will depend upon where you right click in the window and if you highlight any content.
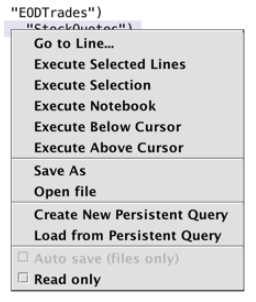
As mentioned earlier, the Notebook can be used as a sandbox for query development and refinement. In support of that intention, the top half of the right-click menu provides shortcuts for quick code execution and testing:
-
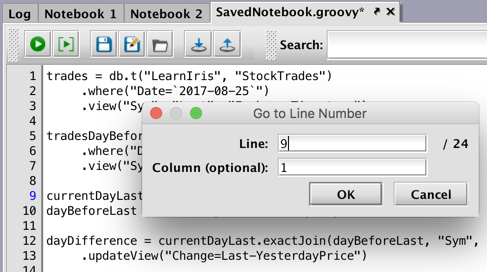
Go to Line… - This option opens the Go to Line Number dialog window, which allows you to go to a line or a column (optional) in the Notebook to easily jump to any location. The dialog can also be accessed using the keyboard shortcut Ctrl+G /⌘+G (macOS).
- Execute Selected Lines - This option copies the entire line(s) of content you have highlighted in the Notebook window, and then executes that content in the Console.
- Execute Selection - This option copies only the content you have highlighted in the Notebook window, and then executes that content in the Console.
- Execute Notebook - This option automatically copies all of the content in the Notebook window, and then executes the content in the Console.
- Execute Below Cursor - This option copies all of the content in the Notebook window that is below the location of your cursor, and then executes that content in the Console.
- Execute Above Cursor - This option copies all of the content in the Notebook window that is above the location of your cursor, and then executes that content in the Console.
The next sections of the right-click menu provide the following options related to saving, opening , loading and creating external files and persistent query scripts:
- Save <filepath/filename> - This option is shown when the content in the Notebook was opened from a previously saved Notebook file on your PC.
- Save As - This option saves the entire notebook to a new Groovy or text file on your PC.
- Open file - This option enables user to open an external text or Groovy file from your PC.
- Update script for <script name> - This option is presented when the content of the notebook was derived from a previously existing persistent query. When selected, this option will update the original persistent query with any changes made in the Notebook.
- Load script from <script name> - This option is presented when the content of the notebook was derived from a previously existing persistent query. When selected, this option provides users the option of loading the content from a specific existing persistent query.
- Create New Persistent Query - This option provides users the option of saving the existing content in the notebook to a new persistent query.
- Load from Persistent Query - This option provides users the option of loading the content of an existing persistent query into the Notebook.
Options in the last section of the right-click menu include the following:
- Auto save (files only) - When a Notebook has been saved to a file, the Auto save (files only) option is activated. When the check box is selected, Deephaven will automatically save the file 3-4 seconds after a subsequent change is made.
- Read only - When the Read only check box is selected, the Notebook cannot be edited.
Other Notebook Options
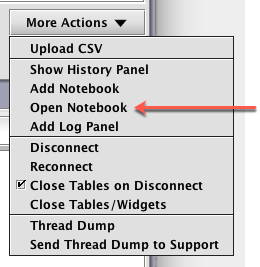
To open an existing notebook, click More Actions and select Open Notebook. A dialog window will then enable you to navigate to the location of an existing notebook on your workspace. Once selected, the notebook will be opened in a new tab.
- Like other console panels, Notebook panels can be rearranged and/or nested into other panel groups. (See: Customizing Your Workspace.)
- If a Notebook has not been saved as a file or as a persistent query, the Notebook's name can be changed by right clicking on the tab for that panel and selecting Rename Tab. Once a Notebook has been saved to a file or a persistent query, the name on the panel's tab cannot be changed with the right-click option.
Comment/Uncomment Content in a Notebook
Content entered in a Notebook (or the Persistent Query Configuration Script Editor) can be converted into Comments (or reverted from Comments) with the following key commands:
- Ctrl + / (Windows); Command + / (macOS): Comment out the selected lines. It will uncomment them if every line starts with a comment "
//". - Ctrl + Shift + / (Windows); Command + Shift + / (macOS): Create a block comment around the selected text. If a block comment is exactly selected from
/*to*/then it will uncomment the selected text.
Autocomplete
In addition to console Hot Keys and the History Panel, Deephaven offers an "autocomplete" feature for the following aspects in a query:
- Namespaces, Table Names
- Column Names for
viewandselect(immediately after at2statement, or from a variable.) - Method Names
- Previous commands you've typed (if none of the above work).
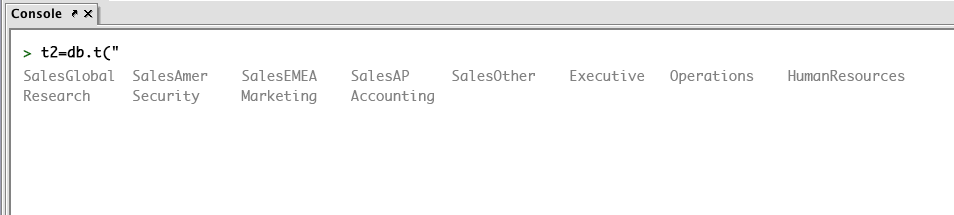
For example, if you type t2=db.t(" and then press the Tab key, the console will first provide a list of installed namespaces. In the first example below, there are 12 namespaces listed.
Note: The namespaces and tables demonstrated below are not loaded with Deephaven.
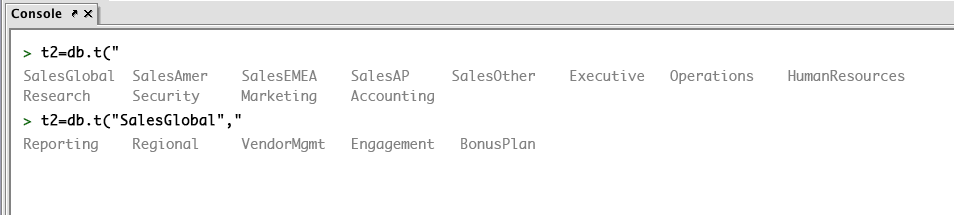
When you click on a namespace value, it will be added to the query. Click the Tab key again and you will see the table names listed in that namespace. In the example below, the namespace SalesGlobal was selected. After pressing the Tab key, five table names appeared.
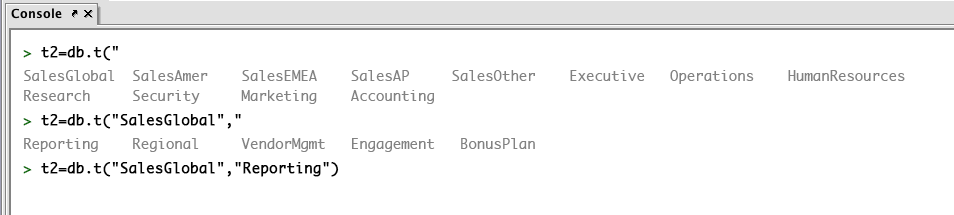
Click on the table name you want to use and it automatically gets added to the query, as shown below.
If there is only one option that fits the autocompletion, or if the possible values for autocompletion all have a common prefix, the console automatically fills in that option for you. If you don't type anything else, you can click on the completion (which turns blue upon mouse over) and it will perform that completion.
If there are more than five lines of available options, you can see all of the autocompletion options by clicking the "N more..." link, or you can type additional text to use for the autocompletion and then press the Tab key again.
Log Window
The Log window is located below the Console window,and presents a record (log) of what your query programming is doing, including data input/output, and processing. This feature is primarily designed for more advanced programmers, but the log can help all users find and resolve errors that may occur.
There are eight different logging levels in Deephaven:
- FATAL - Details about severe events that will likely cause the query to abort.
- STDERR - Presents details about events occurring in the stream where a program writes its own error data.
- ERROR - Presents details about more harmful errors that are occurring even though the query is still running.
- WARN - Presents details about potentially harmful events that are occurring.
- STDOUT - Presents details about events occurring in the stream where a program writes its output data.
- INFO - Presents general information showing the progress of the query
- DEBUG - Presents more specific information that should be useful for debugging
- TRACE - Presents very fine-grained details about events as they occur.
Log Search
Log Search allows you to search the logs for specific keywords/phrases. Simply type the keyword into the field and then press Enter. If present, the keyword will be highlighted in the log. If there are multiple instances of the keyword, you can either scroll through the log window or click on the up and down arrows to the right of the search field to jump directly to the next instance of the search term. You can also select RegEx if your search includes "regular expressions."
Foreground Levels
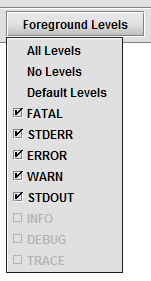
The Foreground Levels drop-down menu allows you to choose which level of logging detail brings the log panel to the foreground of the interface (assuming it is not already). For example, a user may want a FATAL or ERROR log notation to be shown immediately, whereas a TRACE notation would not require such attention.
Selecting All Levels will bring the Log panel to the front every time a log notation is presented in Deephaven. Selecting Default Levels will bring the log panel to the front only when the first five levels of log notations are posted, including FATAL, STDERR, ERROR, WARN, and STDOUT.
Display Log Levels
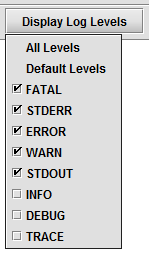
The Display Log Levels drop-down menu allows you to choose the level of details presented in the log window when a query is running.
Selecting All Levels will show every detail of logging presented in Deephaven. Selecting Default Levels will show only the first five levels, including FATAL, STDERR, ERROR, WARN, and STDOUT.
Text/Tabular
The Text/Tabular setting enables the user to set the style of the log to either text or tabular. See samples below.
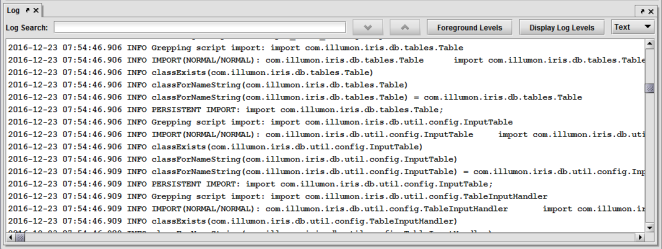
Example of a Text Log
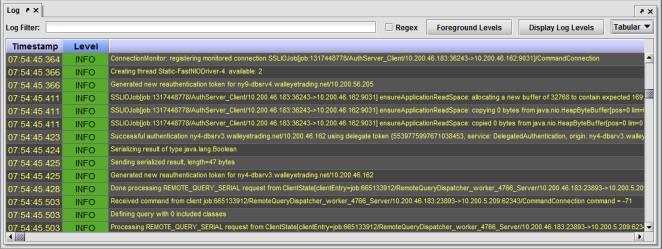
Example of a Tabular Log
Last Updated: 16 February 2021 18:07 -04:00 UTC Deephaven v.1.20200928 (See other versions)
Deephaven Documentation Copyright 2016-2020 Deephaven Data Labs, LLC All Rights Reserved