Pivot Widgets
Just like the pivot tables you're familiar with from popular spreadsheet software, Deephaven's Pivot Widget feature enables you to rearrange and aggregate a large detailed dataset into an at-a-glance summary with one straightforward line of code. Within a single query you can display multiple values, embed auto-filters, and include Grand Totals of your chosen aggregations. Moreover, Pivot Widgets can be combined with Deephaven's OneClick and Linked Views features, unlocking even more insights with only a few clicks.
At this time, Pivots Widgets are only available in Deephaven Classic.
For example, the Pivot Widget below shows a breakdown of the prices of trades for each underlying security based on the Exchange on which they were traded:
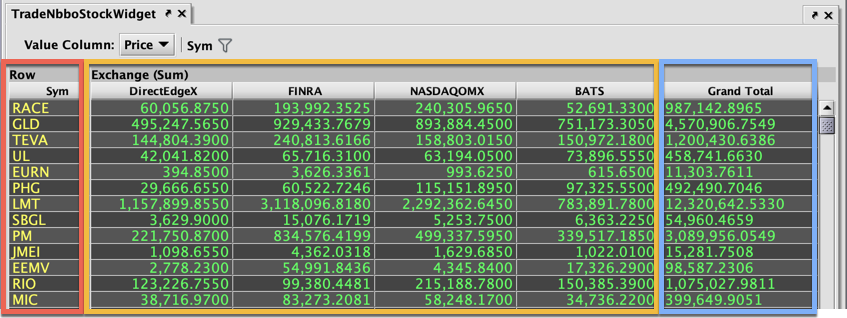
Configured via a Deephaven query, the widget "pivots" the values from a "Header Column" - in this case Exchange - from the source table to become the new header titles in the widget. There are two main sections - the Row table (highlighted in red) derived from the Sym column, and the Value table (highlighted in yellow) containing aggregations from the Price column - and an optional Grand Totals section (highlighted in blue).
Read on to learn how to configure a Pivot Widget using the Deephaven query language. The examples below are also available for download as Deephaven Notebooks for Groovy or Python consoles. To learn more about using Deephaven Notebooks, please refer to the Notebook section of the User Manual.
Download the Pivot Widget Notebooks
Creating a Pivot Widget
To create a Pivot Widget, you must first import the Deephaven PivotWidgetBuilder class then apply the pivot() method to the source table. The basic syntax follows:
from deephaven import *

widget = PivotWidgetBuilder.pivot(t, "rowCol", "headerCol", "valueCol").show()
import com.illumon.iris.console.utils.PivotWidgetBuilder

widget = PivotWidgetBuilder.pivot(t, "rowCol", "headerCol", "valueCol").show()
The query first creates a new instance of the PIvotWidgetBuilder class, applies the pivot() method to the source table (t), and then defines the three required arguments:
rowCol- This column specifies the key values for the Pivot Widget rows, which appear in the Row pane at the left side of the widget. One Row Column is required, but additional Row Columns can be set if desired.headerCol- This column from the source table is pivoted to become the new column headers in the widget's Value pane. Only one Header Column can be set.valueCol- These columns produce the values that will display in the main Value pane in the widget. Only one set of data can be displayed at one time. When multiple Value Columns are assigned in the query, the widget will include a drop-down list of the available choices.
The show() method is then applied so the widget can be presented in the Deephaven console.
Example
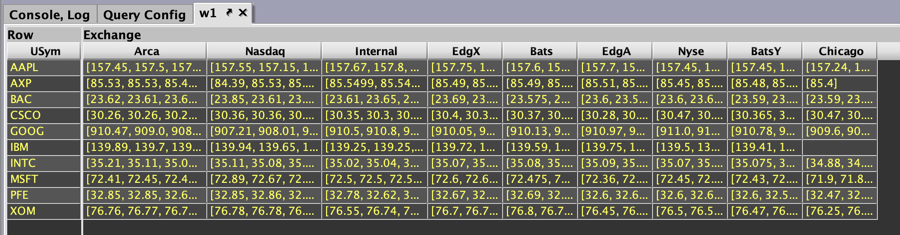
The following example query demonstrates how to create a simple Pivot Widget using data from the StockTrades table in the LearnDeephaven namespace. This widget presents a new row for each unique USym and a new header title column for each unique Exchange value. The value cells are then populated with arrays containing the Last values for each key/header pair.
from deephaven import *

t=db.t("LearnDeephaven", "StockTrades").where("Date=`2017-08-21`")
w1 = PivotWidgetBuilder.pivot(t, "USym", "Exchange", "Last").show()
import com.illumon.iris.console.utils.PivotWidgetBuilder

t=db.t("LearnDeephaven", "StockTrades").where("Date=`2017-08-21`")
w1 = PivotWidgetBuilder.pivot(t, "USym", "Exchange", "Last").show()
The resulting Pivot Widget is shown below. Its rows show the respective values associated with each unique Sym and each unique Exchange.
This was a very basic example, but the following sections will provide a series of examples to demonstrate the range of options available when building a Pivot Widget. These options include adding more Row Columns, aggregating data, generating Grand Totals, and applying AutoFilters to your Pivot Widget. Each of these options can be used individually or collectively to customize the pivot table.
Adding Additional Row Columns
The previous query used only one Row Column for the Row pane. However, additional Row Columns can be added to the widget using the addRows() method. The syntax follows:
.addRows("rowCol")
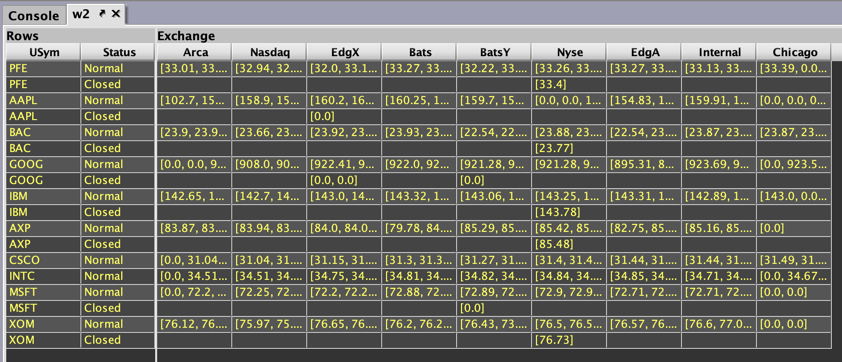
The following query creates a Pivot Widget using data from the table StockQuotes in the LearnDeephaven namespace. In this example, two Row Columns are included in the Row pane:
t2=db.t("LearnDeephaven", "StockQuotes").where("Date=`2017-08-25`")
w2 = PivotWidgetBuilder.pivot(t2, "USym", "Exchange", "Bid") \
    .addRows("Status") \
    .show()
t2=db.t("LearnDeephaven", "StockQuotes").where("Date=`2017-08-25`")
w2 = PivotWidgetBuilder.pivot(t2, "USym", "Exchange", "Bid")
        .addRows("Status")
        .show()
When the query is run in the console, the w2 Pivot Widget is created, as shown below:
Adding Additional Value Columns
You can add multiple Value Columns to any Pivot Widget in Deephaven using the addValueColumns() method. However, only one set of values can be viewed at a time. When additional Value Columns are present in the query, a drop-down list at the top of the widget will enable users to view their chosen set of values.
The syntax for including multiple Value Columns follows:
.addValueColumns("valueCol" , valueCol")
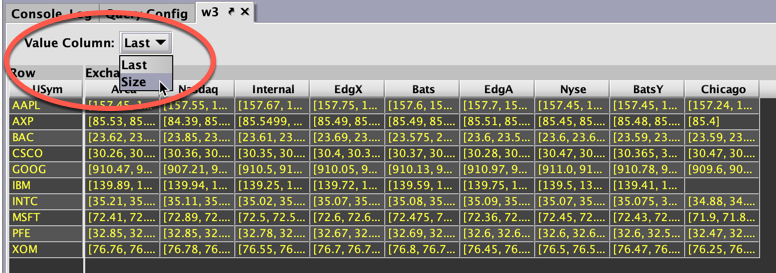
The example below creates a Pivot Widget that enable users to switch among two Value Columns chosen from the source table, t (StockTrades). The first Value Column is included as an argument to the pivot() method. The second Value Column is included as the argument to the addValueColumns() method.
w3 = PivotWidgetBuilder.pivot(t, "USym", "Exchange", "Last") \
    .addValueColumns("Size") \
    .show()
w3 = PivotWidgetBuilder.pivot(t, "USym", "Exchange", "Last")
        .addValueColumns("Size")
        .show()
When the query is run in the console, the w3 Pivot Widget is created, as shown below. The drop-down menu provides users with the option to view either Value Column.
Adding Aggregations
By default, a Pivot Widget displays the data from the chosen Value Column as an array. The data in these arrays can be aggregated by adding either sum() or avg() to the query.
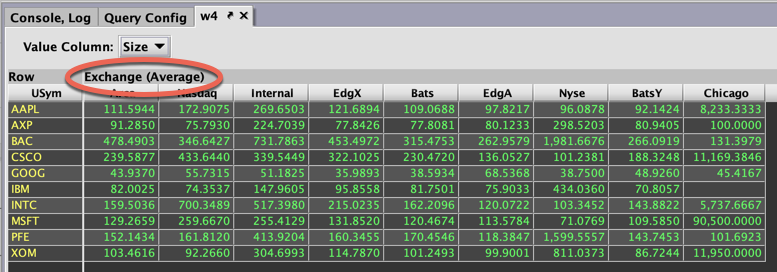
The example below creates a Pivot Widget that averages the values in the Exchange column arrays for each unique USym:
w4 = PivotWidgetBuilder.pivot(t, "USym", "Exchange", "Last") \
    .addValueColumns("Size") \
    .avg() \
    .show()
w4 = PivotWidgetBuilder.pivot(t, "USym", "Exchange", "Last")
        .addValueColumns("Size")
        .avg()
        .show()
When the query is run in the console, the w4 Pivot Widget is created, as shown below. The aggregation method selected is enclosed in parentheses following the name of the Header Column:
Adding Grand Totals
If an aggregation operation is included in the query for a Pivot Widget, the data for each row and/or each column can be further summarized into Grand Totals.
The following methods are available, and can be used individually or collectively:
across()- Using this method will add a Grand Total pane to the right side of the widget. Data in that pane will be aggregated by row.down()- Using this method will add a Grand Total row to the bottom of your widget. Data in that row will be aggregated by column.
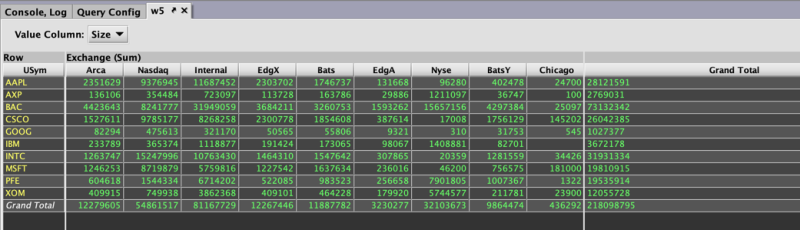
The example query below includes a Grand Total pane and Grand Total row that sums the values in the widget rows and columns, respectively:
w5 = PivotWidgetBuilder.pivot(t, "USym", "Exchange", "Last") \
    .addValueColumns("Size") \
    .sum() \
    .across() \
    .down() \
    .show()
w5 = PivotWidgetBuilder.pivot(t, "USym", "Exchange", "Last")
        .addValueColumns("Size")
        .sum()
        .across()
        .down()
        .show()
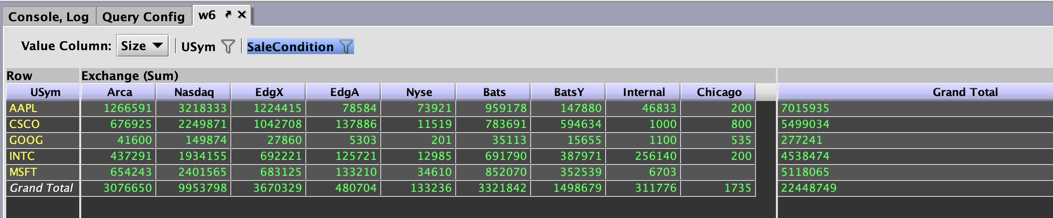
When the query is run in the console, the w5 Pivot Widget is created, as shown below. The Grand Total pane on the right shows the totaled values of each row. The Grand Total row at the bottom shows the totaled values of each column:
By default, the data in the Grand Total pane will be aggregated using the same aggregation method as the value table. If desired, you can specifically set the aggregation for the Grand Totals, which may differ from the aggregation set for the value table, by including one of the following additional methods:
sumTotals()- Data in the Grand Total pane will sum the values in each row or column.avgTotals()- Data in the Grand Total pane will average the values in each row or column.
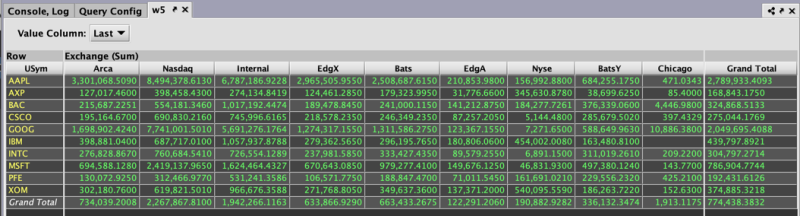
The example query below sums the pivot widget and includes a Grand Total pane and Grand Total row that averages the values in the widget rows and columns, respectively.
w5 = PivotWidgetBuilder.pivot(t, "USym", "Exchange", "Last") \
    .addValueColumns("Size") \
    .sum() \
    .across() \
    .down() \
    .avgTotals() \
    .show()
w5 = PivotWidgetBuilder.pivot(t, "USym", "Exchange", "Last")
        .addValueColumns("Size")
        .sum()
        .across()
        .down()
        .avgTotals()
        .show()
When the query is run in the console, the w5 Pivot Widget is updated, as shown below. The value table still shows the sum for the selected value column. However, the Grand Total pane on the right now shows the averaged values of each row. The Grand Total row at the bottom now shows the averaged values of each column:
Adding Filter Columns
Deephaven AutoFilters can be added to your Pivot Widget using the following syntax:
.addFilterColumns("colName")
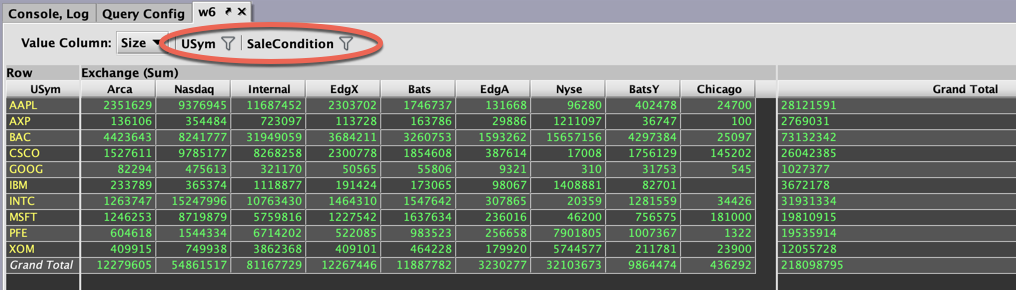
There are no restrictions on which columns can be set as Filter columns. The example below includes two AutoFilters that generate a list from the values in the USym and SaleCondition columns respectively in the source table:
w6 = PivotWidgetBuilder.pivot(t, "USym", "Exchange", "Last") \
    .addValueColumns("Size") \
    .addFilterColumns("USym", "SaleCondition") \
    .sum().across().down() \
    .show()
w6 = PivotWidgetBuilder.pivot(t, "USym", "Exchange", "Last")
        .addValueColumns("Size")
        .addFilterColumns("USym", "SaleCondition")
        .sum().across().down()
        .show()
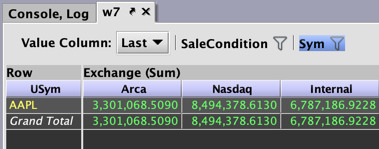
When the query is run in the console, the w6 Pivot Widget is created. The two Autofilters are shown to the right of the Value Column drop-down menu:
Selecting SaleCondition at the top of the widget opens the AutoFilter dialog window, which contains the distinct values available within the source table's SaleCondition column, as shown below:
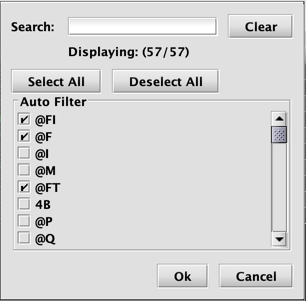
To filter the widget, select the desired value(s) and click Ok.
The data in the Pivot Widget will filter accordingly. Note: the name of the AutoFilter will be highlighted in blue when active, as shown below:
The default initial fetch size in the AutoFilter dialog is 1,000 unique items. This can be changed by including the following method in the Pivot Widget query:
.autoFilterFetchSize(filterColumn, initialFetchSize)
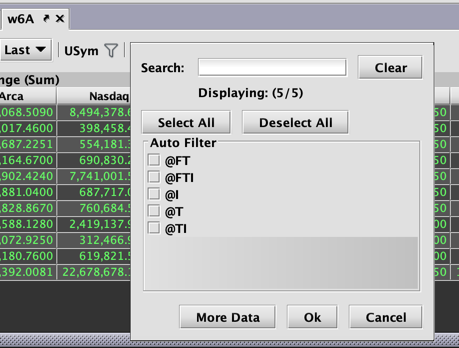
In the following example, the query for table w6 has been updated to limit the fetch size on the SaleCondition AutoFilter to five items.
w6 = PivotWidgetBuilder.pivot(t, "USym", "Exchange", "Last") \
    .addValueColumns("Size") \
    .addFilterColumns("USym", "SaleCondition") \
    .autoFilterFetchSize("SaleCondition", 5) \
    .sum().across().down() \
    .show()
w6A = PivotWidgetBuilder.pivot(t, "USym", "Exchange", "Last")
        .addValueColumns("Size")
        .addFilterColumns("USym", "SaleCondition")
        .autoFilterFetchSize("SaleCondition", 5)
        .sum().across().down()
        .show()
The default fetch size also can be globally by modifying the property:
AutoFilterSelectionPanel.defaultInitialFetchSize=[size]
Additionally, modifying the maximum cache size will keep selected values in the cache so that they always appear in the AutoFilter dialog regardless of the fetch size.
AutoFilterSelectionPanel.maxCacheSize=[size]
This property defaults to 100. Cached items appear first (even after they become unselected).
These should be configured in the iris_console and interactive_console stanza.
See also: AutoFilter Column Filtering
Creating Pivot Widgets with a large amount of data may take time to calculate. This time can be reduced by requiring the Pivot Widget to first be filtered on one or more of the columns in the table. This can be accomplished by using the requireFilteredColumns() method in the query. Before the Pivot Widget is created in the Deephaven console, all columns specified in the method's argument must be filtered using an AutoFIlter or OneClick filter. The syntax follows:
.requireFilteredColumns("colName")
An example of its use is demonstrated below:
w7 = PivotWidgetBuilder.pivot(t, "USym", "Exchange", "Last") \
    .addValueColumns("Size") \
    .addFilterColumns("SaleCondition") \
    .requireFilteredColumns("Sym") \
    .sum().across().down() \
    .show()
w7 = PivotWidgetBuilder.pivot(t, "USym", "Exchange", "Last")
        .addValueColumns("Size")
        .addFilterColumns("SaleCondition")
        .requireFilteredColumns("Sym")
        .sum().across().down()
        .show()
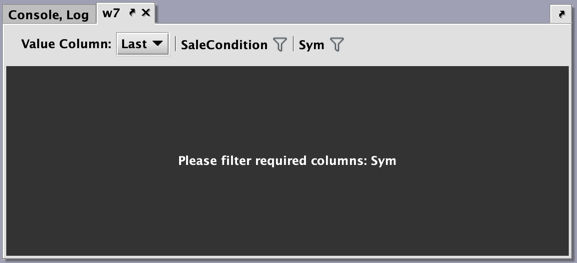
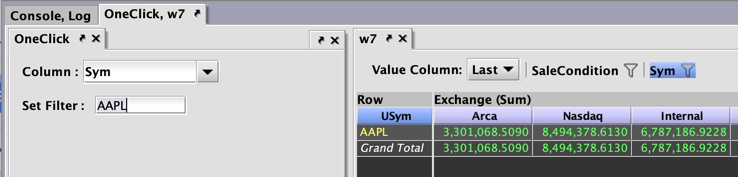
After the query runs, the user will be prompted to filter the Sym column, which can be accomplished using an AutoFilter or a OneClick filter as shown below:
Adding a First or Last Aggregator
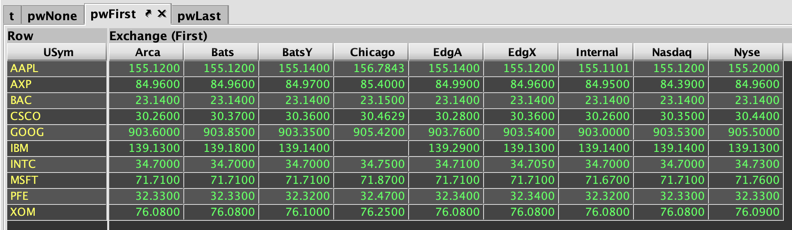
You can also apply a first() or last() aggregator to the Pivot Widget, where first() returns the first array value from the value column for the particular header value, and last() returns the last array value from the value column for the particular header value.
For example, in the following query where the Pivot Widget is sorted on the "Last" column, applying a first() aggregation returns the minimum array value.
from deephaven import *
t=db.t("LearnDeephaven", "StockTrades").where("Date=`2017-08-21`")

pwNone = PivotWidgetBuilder.pivot(t.sort("USym", "Exchange", "Last"), "USym", "Exchange", "Last").show()

pwFirst = PivotWidgetBuilder.pivot(t.sort("USym", "Exchange", "Last"), "USym", "Exchange", "Last")\
    .first()\
.show()import com.illumon.iris.console.utils.PivotWidgetBuilder
t=db.t("LearnDeephaven", "StockTrades").where("Date=`2017-08-21`")
pwNone = PivotWidgetBuilder.pivot(t.sort("USym", "Exchange", "Last"), "USym", "Exchange", "Last").show()
pwFirst = PivotWidgetBuilder.pivot(t.sort("USym", "Exchange", "Last"), "USym", "Exchange", "Last")
.first()
.show()
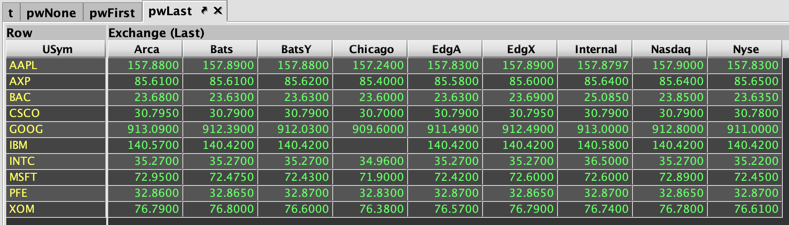
In the next example, applying a last() aggregation returns the maximum array value.
pwLast = PivotWidgetBuilder.pivot(t.sort("USym", "Exchange", "Last"), "USym", "Exchange", "Last")\
    .last()\
.show()pwLast = PivotWidgetBuilder.pivot(t.sort("USym", "Exchange", "Last"), "USym", "Exchange", "Last")
.last()
.show()
Applying a Sort Order
Various sort orders can be added to your query using the following methods:
sortRows(columnName)- Sorts in ascending order on a specified column within the main value table or row pane.sortRowsDescending(columnName)- Sorts in descending order on a specified column within the main value table or row pane.sortRowsByTotals()- Sorts in ascending order on the total column if it is included within the query.sortRowsByTotalsDescending()- Sorts in descending order on the total column if it is included within the query.sortColumnTitles()- Sorts the Header Titles/columns in ascending order.
Specifying Column Order
Pivot Widget "row" columns are ordered based on occurrence of their values in the underlying table. However, you may specify column ordering in your query without have to re-sort the source table, though this is recommended in cases where values are well-known. The following methods are available:
sortRowsCustom(firstKey)sortColumnsCustom(firstKey)followedBy(key)
The method .sortRowsCustom(firstKey)takes a list of values that define the first item that should be displayed. The number of parameter items depends on the number of row keys. For example, if you are only pivoting on USym, there should only be a single parameter:
e.g., .sortRowsCustom("AAPL")
If you are pivoting on "USym" and "Exchange" you should provide a pair of values:
e.g., .sortRowsCustom("AAPL", "NYSE")
After this method is invoked, it may be followed by as many invocations of followedBy(...) as required to continue defining the order. Finally, invoke . done() to return to the PivotWidgetBuilder.
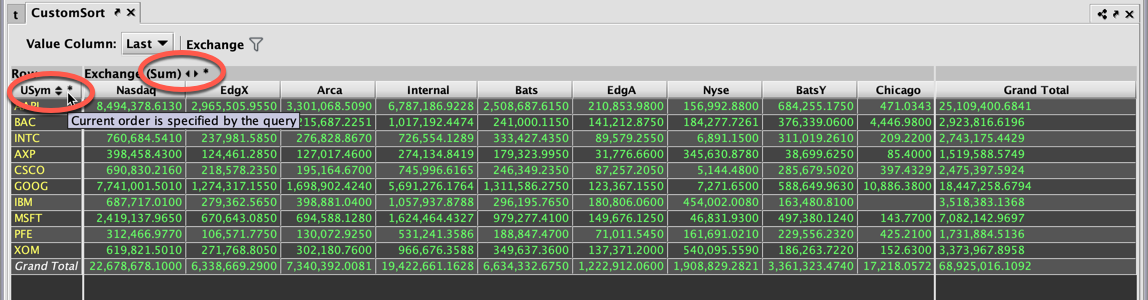
The .sortColumnsCustom(firstKey) method follows the same rules as illustrated above, except that it controls the column ordering instead of the row ordering. These methods may be combined, as in the example query below.
from deephaven import *

t=db.t("LearnDeephaven", "StockTrades").where("Date=`2017-08-21`")

CustomSort = PivotWidgetBuilder.pivot(t, "USym", "Exchange", "Last") \
    .addValueColumns("Size") \
    .addFilterColumns("Exchange") \
    .sum().across().down() \
	.sortRowsCustom("AAPL") \
		.followedBy("BAC") \
		.followedBy("INTC") \
		.followedBy("AXP") \
		.followedBy("CSCO") \
	.done() \
	.sortColumnsCustom("Nasdaq") \
		.followedBy("EdgX") \
		.followedBy("Arca") \
		.followedBy("Internal") \
	.done() \
    .show()
import com.illumon.iris.console.utils.PivotWidgetBuilder

t=db.t("LearnDeephaven", "StockTrades").where("Date=`2017-08-21`")

CustomSort = PivotWidgetBuilder.pivot(t, "USym", "Exchange", "Last")
    .addValueColumns("Size")
    .addFilterColumns("Exchange")
    .sum().across().down()
	.sortRowsCustom("AAPL")
		.followedBy("BAC")
		.followedBy("INTC")
		.followedBy("AXP")
		.followedBy("CSCO")
	.done()
	.sortColumnsCustom("Nasdaq")
		.followedBy("EdgX")
		.followedBy("Arca")
		.followedBy("Internal")
	.done()
    .show()
A new sorting icon will be displayed for rows (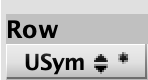 ) and columns(
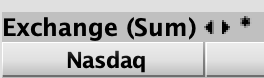 ) that have been ordered by the query. These orders are used when the rows/columns are in the "unsorted" state. Changing the sorting order to Ascending or Descending will then sort the rows/columns in their natural ascending or descending order.
Showing and Closing Pivot Widgets
Pivot Widgets created by persistent queries can be accessed using the Show Widget button in the Query Config panel. Alternatively, if a Pivot Widget is created by a query running in the console and then closed, the Pivot Widget can be reopened in that session using the Show Widget button in the workspace.
Working with Pivot Widgets
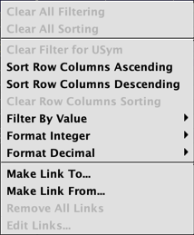
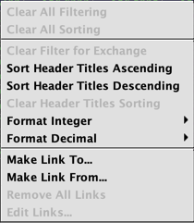
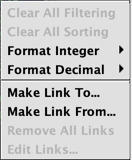
Each pane in the Pivot Widget has its own unique right-click menu. This section discusses the options available in these menus and how to perform basic operations like filtering and sorting data in a Pivot Widget.
Right-Click Menus
|
Row |
Value |
Grand Total |
|---|---|---|
|
Header Menu
Table Data Menu
|
|
|
Filtering
A Pivot Widget can be filtered by adding AutoFilters to the query that creates it (see Adding Filter Columns above), by configuring Linked Views (see Using Linked Views below), and by pairing the widget with a OneClick panel in the Deephaven console (see OneClick Filtering below). While the Filter Builder is not available in Pivot Widgets, the Row pane includes a similar Filter By Value option in its table data menu.
Filter By Value
Right-clicking within a cell in the Row pane opens the table data menu. Select Filter By Value to access eight simple filter options:
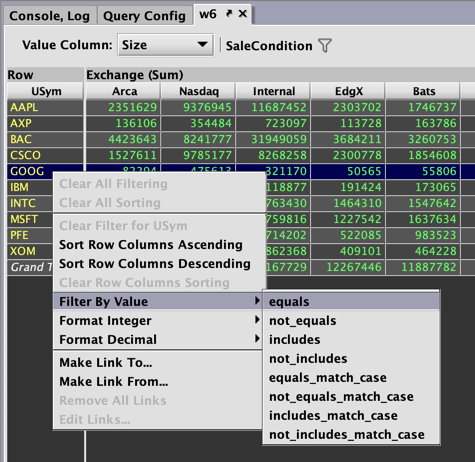
In the example above, the right-click occurred in a cell containing GOOG. Therefore, the filter selected will reduce the data in the widget to show only values for GOOG, as shown below:
Using Linked Views
Linked Views is a feature in Deephaven that enables a user to interactively filter the content in one Deephaven table or widget based on the content selected in another Deephaven table. The Pivot Widget can be either a Target or Source in a Linked Views pair.
Make Link To...
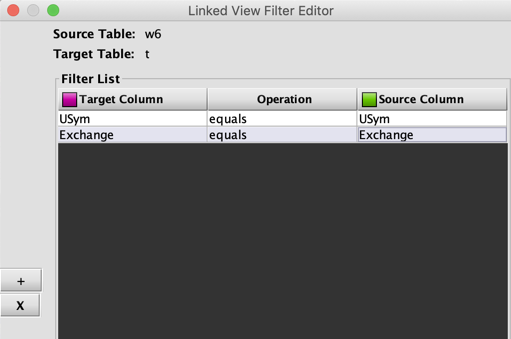
To properly configure Linked Views when the Pivot Widget is a link Source, you must link at least one of the Row Columns and the Header Column. Double-clicking on a cell in the Value pane will filter the link target so that its table data matches the values used to compute that cell value in the Pivot Widget.
In the following example, the link Source is Pivot Widget w6, and the link Target is the StockTrades table filtered to August 21, 2017:
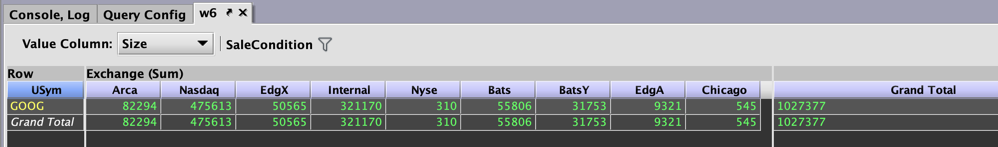
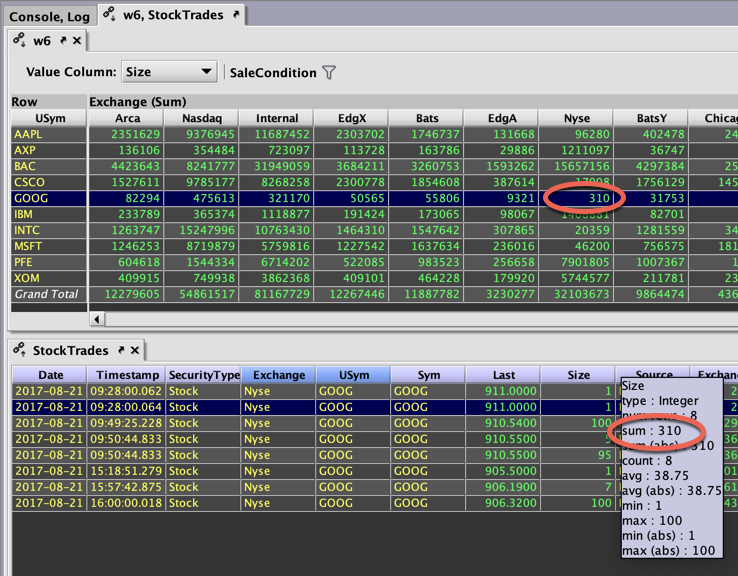
Double-clicking a Pivot Widget cell in the GOOG row in the Nyse column filters StockTrades to show all the sizes that were averaged together to produce that Size value (a sum of 310):
Filters applied to Source tables and widgets are also linked to the respective Targets. For example, if the AutoFilter on the Source widget (w6) was active, its target StockTrades table would be filtered accordingly.
As shown below, the Pivot Widget is first filtered to three SaleCondition values, then double-clicking on the GOOG size value of 201 filters the source table:

While this example links the Pivot Widget to the source table that produced it, Pivot Widgets can be linked to or from any Deephaven table.
Make Link From...
When the Pivot Widget is a Target for Linked Views, filters applied in the Source will also apply in the Target. If the Target column in the Linked View Filter Editor is a Row Column in the Target widget, clicking within the Source table will filter out entire rows from the Pivot Widget. If the Target column is a Header Column, clicking within the Source table will filter out columns from the Value pane, as shown below:
Note: you cannot link Filter Columns (doing so will prompt you to reconfigure your links when attempting to filter the target table).
See also: Linked Views
OneClick Filtering
OneClick filters can be used with Pivot Widgets in the same manner as with tables and plots. Simply, click the OneClick button at the top of the console and nest the new OneClick panel with the widget you wish to filter. Then, choose a column to filter and set the desired value.
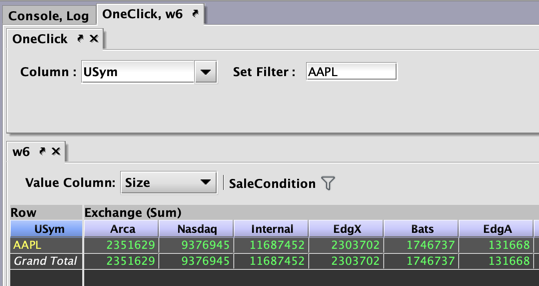
Selecting a OneClick column from the Row pane of the widget works the same way as with any Deephaven table. For example, the following OneClick panel filters widget w6 to the USym AAPL:
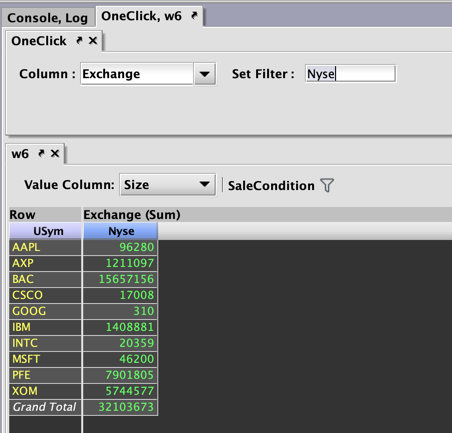
However, selecting a OneClick column found in the Value pane works slightly differently. Selecting the source table's Header Column in the OneClick panel (in this case Exchange) will reduce your Pivot Widget's Value pane to a single column. This is because the OneClick is actually filtering rows from the source table that was used to create the widget. For example, the following OneClick panel filters Pivot Widget w6 to the Exchange value of Nyse:
To learn more, see: OneClick
Once a filter has been applied to the Pivot Widget, the Clear All Filtering and Clear Filter on [Column] options become available in the applicable right-click menu:

The optional Grand Total pane will change according to any filters applied to the two core tables. It cannot be filtered individually. Note that selecting Clear All Filtering from its right-click menu will clear all filters within the widget.
Sorting
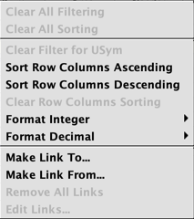
As with a typical Deephaven table, clicking a column header will Sort/Unsort that column. Alternatively, you can select Sort Row Columns Ascending, Sort Row Columns Descending, or Clear All Sorting in the right-click menu of the Row pane.
In the Value pane, selecting Sort Header Titles Ascending or Sort Header Titles Descending will rearrange all the columns in the desired order.
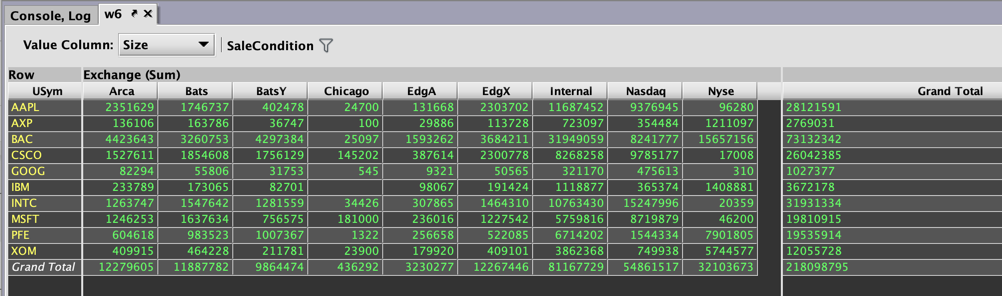
In Pivot Widget w6 below, the Header Titles/columns have been sorted in ascending order:
To revert the Value pane to its original order, select Clear Header Titles Sorting.
Notes:
- Selecting Clear All Sorting from any right-click menu will clear all sorts within the entire widget.
- The optional Grand Total pane will automatically sort when the Row pane is sorted.
- Column title sorting occurs pre-transform: i.e., the sort operation is performed before the specified Header columns are renamed (see Renaming Header Columns below).
- A null value (or any non-sortable) type in the main Value pane header will disable Header Title sorting.
Formatting Numeric Data
It is possible to change the numeric format of the data within any of the panes within the Pivot Widget using the right-click options Format Integer or Format Decimal. Your selection will only apply to the pane within which you clicked to access the menu. Note: in this case, the Grand Totals pane may be formatted independently of the other two tables.
To learn more, see: Formatting Numeric Data in Columns
This may also be accomplished using the Deephaven query language. The following methods are available:
|
Syntax |
Explanation |
|---|---|
|
|
Sets the decimal format for the Value pane. |
|
|
Sets the decimal format for the Row pane. |
|
|
Sets the decimal format for the Totals pane. |
|
|
Sets the integer format for the Value pane. |
|
|
Sets the integer format for the Row pane. |
|
|
Sets the integer format for the Totals pane. |
To learn more, see Formatting Tables > Numeric Formatting
Formatting Color
It is possible to adjust the color formatting of pivot widgets using the Deephaven query language:
.setColorFormat(Function<Object, Object> colorFormat)
The Closure in setColorFormat takes one of these three values:
- Long:
e.g.,{ val -> val > 0 ? 143833713130660064L : 0L} - Color: e.g.,
{val -> val < 100 ? COLOR_BLUE : COLOR_GREEN} - String value representing a Color :
e.g., {val -> val < 100 ? "BLUE" : "GREEN"}
Both user-defined and predefined variables will work in the closure.
Heat Maps
The following method will display a heat map in the Pivot Widget:
heatMap(boolean, Color min, Color max)
"True" is the default value. The next two parameters are optional: "Color min" is used for lower values, and "Color max" for higher values. If not set, the heat map colors will be orange and blue by default. Otherwise, the coloration conforms to the user's choices in the setColorFormat method, as demonstrated in examples that follow.
The following examples modify the same pivot widget created from the StockTrades table:
import com.illumon.iris.console.utils.PivotWidgetBuilder
t=db.t("LearnDeephaven", "StockTrades").where("Date=`2017-08-21`")
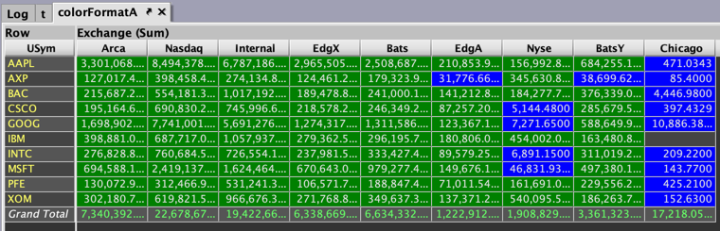
Example 1
A = {val -> val < 50000 ? "BLUE" : "GREEN"}

colorFormatA = PivotWidgetBuilder.pivot(t, "USym", "Exchange", "Last")
    .sum().across().down()
    .heatMap().setColorFormat(A)
    .show()
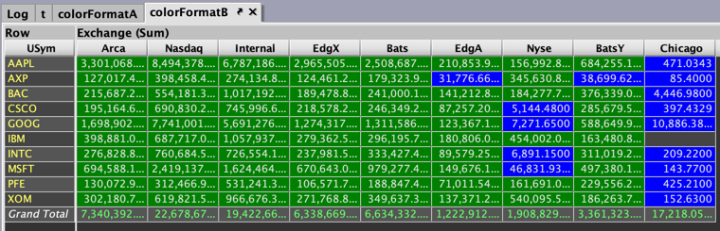
Example 2
B = {val -> val < 50000 ? COLOR_BLUE : COLOR_GREEN}
colorFormatB = PivotWidgetBuilder.pivot(t, "USym", "Exchange", "Last")
    .sum().across().down()
.heatMap().setColorFormat(B)
    .show()
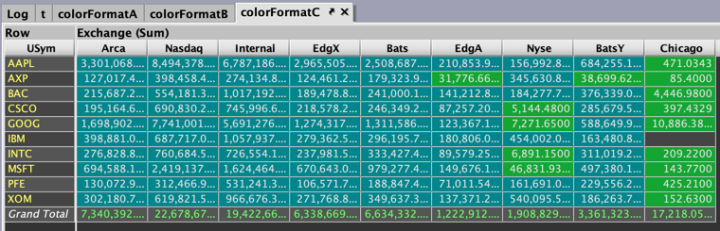
Example 3
import com.illumon.iris.db.util.DBColorUtil

C = {val -> val < 50000 ? DBColorUtil.VIVID_GREEN : DBColorUtil.VIVID_BLUE}

colorFormatC = PivotWidgetBuilder.pivot(t, "USym", "Exchange", "Last")
    .sum().across().down()
    .heatMap().setColorFormat(C)
    .show()
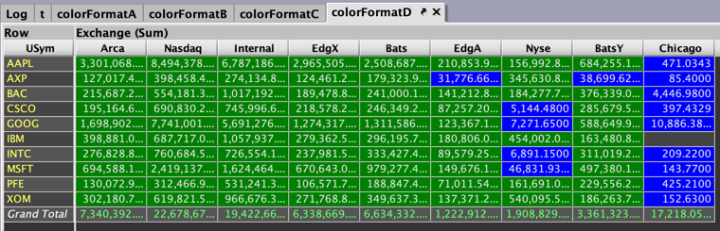
Example 4
import com.illumon.iris.db.util.DBColorUtil

D = {val -> val < 50000 ? DBColorUtil.toLong("BLUE") : DBColorUtil.toLong("GREEN")}

colorFormatD = PivotWidgetBuilder.pivot(t, "USym", "Exchange", "Last")
    .sum().across().down()
    .heatMap().setColorFormat(D)
    .show()
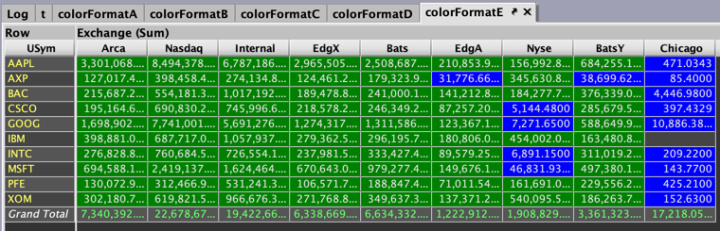
Example 5
import com.illumon.iris.db.util.DBColorUtil

a = DBColorUtil.toLong("BLUE")
b = DBColorUtil.toLong("GREEN")

E = {val -> val < 50000 ? a : b}

colorFormatE = PivotWidgetBuilder.pivot(t, "USym", "Exchange", "Last")
    .sum().across().down()
    .heatMap().setColorFormat(E)
    .show()
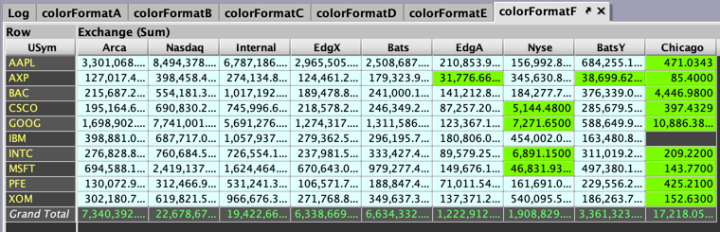
Example 6
import com.illumon.iris.gui.color.Color

F = {val -> val < 50000 ? Color.LAWNGREEN : Color.LIGHTCYAN}

colorFormatF = PivotWidgetBuilder.pivot(t, "USym", "Exchange", "Last")
    .sum().across().down()
    .heatMap().setColorFormat(F)
    .show()
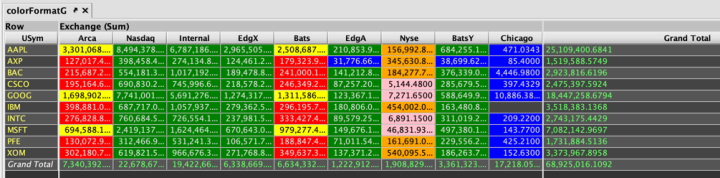
By default, the minimum and maximum values will apply to all the columns in the Pivot Widget. It is also possible to set the min/max coloring ranges dynamically per column by including multiple setColorFormat arguments within your query (see Example 7 below).
Example 7
A = {val -> val < 50000 ? "BLUE" : "GREEN"}
B = {val -> val < 500000 ? "RED" : "YELLOW"}
C = {val -> val < 50000 ? "PINK" : "ORANGE"}

colorFormatG = PivotWidgetBuilder.pivot(t, "USym", "Exchange", "Last")
    .sum().across().down()
    .heatMap().setColorFormat(A)
    .heatMap().setColorFormat(C, "Nyse")
    .heatMap().setColorFormat(B, "Bats","Arca")
    .show()
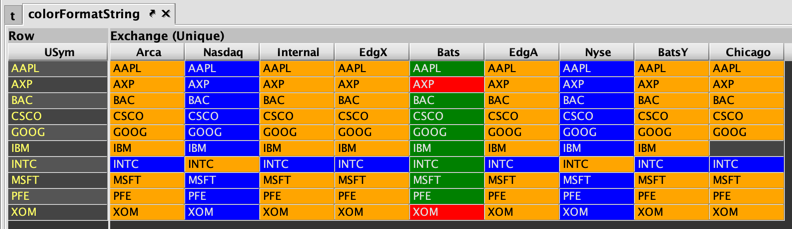
To allow heat maps for String data, include the unique() aggregator in your query.
Example 8
import com.illumon.iris.console.utils.PivotWidgetBuilder
t=db.t("LearnDeephaven", "StockTrades").where("Date=`2017-08-21`")
C = {val -> "INTC".equals(val) ? "BLUE" : "ORANGE"}
D = {val -> !"INTC".equals(val) ? "BLUE" : "ORANGE"}
E = {val -> val.contains('X') ? "RED" : "GREEN"}colorFormatString = PivotWidgetBuilder.pivot(t.firstBy("USym", "Exchange"), "USym", "Exchange", "Sym")
.unique()
.setColorFormat(C)
.setColorFormat(D, "Nyse", "Nasdaq")
.setColorFormat(E, "Bats")
.show()
To learn more, see Formatting Tables > Color Formatting
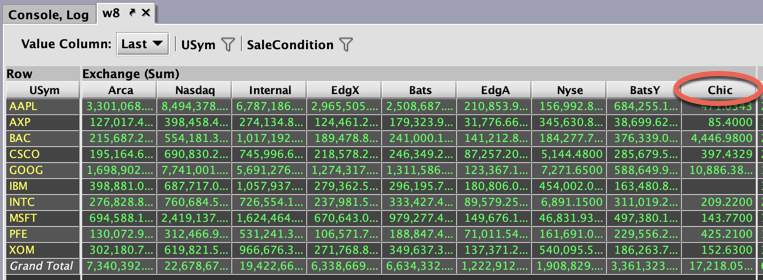
Renaming Header Columns
In order to rename the Header title columns in a pivot widget, the .setColumnNameTransform method, which takes a Groovy closure, should be used. The syntax follows:
.setColumnNameTransform({value -> value.equals("colName") ? "newColName" : value})
For example, the following query shortens the name of the "Chicago" column in widget w6:
from deephaven import *
t = db.t("LearnDeephaven", "StockTrades").where("Date=`2017-08-21`")

renamer = PythonFunction(lambda value: "Chic" if value == "Chicago" else value, 'java.lang.String')
pwRename = PivotWidgetBuilder.pivot(t, "USym", "Exchange", "Last")\
   .addValueColumns("Size")\
   .addFilterColumns("USym", "SaleCondition")\
   .sum()\
   .across()\
   .setColumnNameTransform(renamer)\
   .down()\
.show()w8 = PivotWidgetBuilder.pivot(t, "USym", "Exchange", "Last")
.addValueColumns("Size")
.addFilterColumns("USym", "SaleCondition")
.sum().across().down()
.setColumnNameTransform({value -> value.equals("Chicago") ? "Chic" : value})
.show()
Last Updated: 16 February 2021 18:07 -04:00 UTC Deephaven v.1.20200928 (See other versions)
Deephaven Documentation Copyright 2016-2020 Deephaven Data Labs, LLC All Rights Reserved