Using OneClick with Charts
The OneClick filter is used for advanced filtering of data. With just "one click" of the mouse, the OneClick filter can enable data analysts to focus on one specific item (or a list of values) presented in a table or a plot. See OneClick to learn more.
When using the OneClick feature to filter a plot (or plots), the data source must be a SelectableDataSet. This is easily accomplished with the use of the oneClick method.
Syntax
oneClick(source, "ColName1", "ColName2", …)
sourceis the table containing the data.- Additional arguments represent the name(s) of each column (as a string) to be available for filtering via the OneClick feature.
Example
from deephaven import Plot

t = db.t("LearnDeephaven","StockTrades") \
    .where("Date=`2017-08-21`") \
    .where("USym in `AAPL`,`GOOG`,`CSCO`,`IBM`,`MSFT`,`INTC`")
toc = Plot.oneClick(t, "USym")
RetailPlot = Plot.plot("USym", toc, "Timestamp", "Last").show()
t = db.t("LearnDeephaven","StockTrades")
    .where("Date=`2017-08-21`")
    .where("USym in `AAPL`,`GOOG`,`CSCO`,`IBM`,`MSFT`,`INTC`")
toc = oneClick(t, "USym")
RetailPlot = plot("USym", toc, "Timestamp", "Last").show()
| Code |
Explanation |
|---|---|
|
|
The first line of the query sources the data for six different |
|
|
The second line of the query applies the |
|
|
The third line of the query creates a plot using data from the variable |
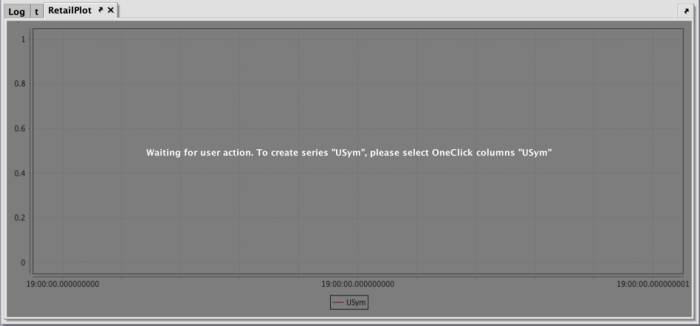
When the query runs, a panel named RetailPlot is presented in the console, as shown below. The data used to generate the plot is a SelectableDataSet now, so no data is being shown.
To show the data, the OneClick filter first needs to be nested in the same panel group as the plot, as shown below.
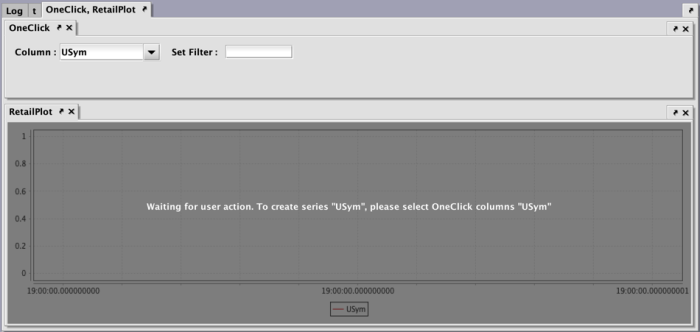
(See: Customizing Your Workspace for more information about nesting panels in the Deephaven console.)
Once an appropriate value is entered into the OneClick filter, the plot for that USym appears, as shown below.
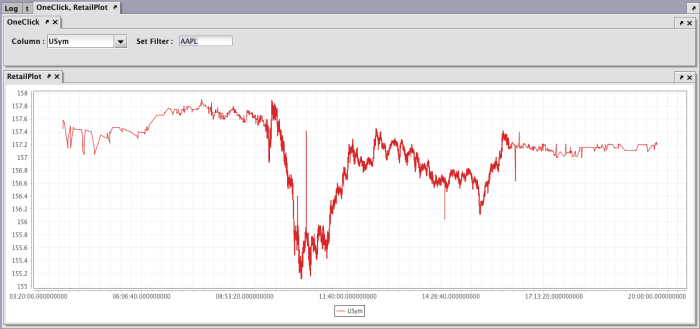
To see a different USym plotted, enter its value in the OneClick filter to generate the plot for the new value.

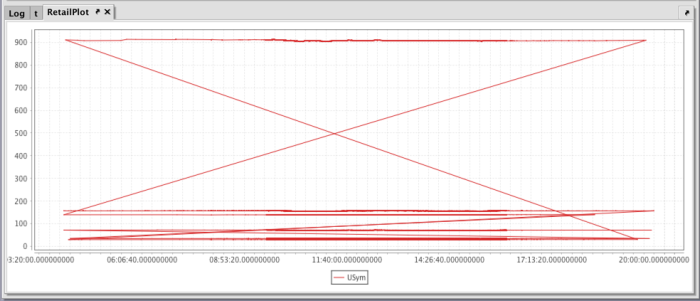
However, including an optional boolean argument set to "false" will plot the entire table without a OneClick filter applied.
Example
from deephaven import Plot

tAAPL = db.t("LearnDeephaven","StockTrades")\
    .where("Date>=`2017-08-21`","USym = `AAPL`")
Rtrades = Plot.plot("Stock Trades", oneClick(AAPL, false, "Date"), "Timestamp", "Last")\
    .xBusinessTime()\
    .show()
tAAPL = db.t("LearnDeephaven","StockTrades")
    .where("Date>=`2017-08-21`","USym = `AAPL`")
trades = plot("tAAPL", oneClick(tAAPL, false, "Date"), "Timestamp", "Last").xBusinessTime().show()
t = db.t("LearnDeephaven","StockTrades")
.where("Date=`2017-08-21`")
.where("USym in `AAPL`,`GOOG`,`CSCO`,`IBM`,`MSFT`,`INTC`")
toc = oneClick(t, false, "USym")
RetailPlot = plot("USym", toc, "Timestamp", "Last").show()
OneClick filters will work as before. When the Set Filter field is empty, all filters will be cleared and the plot will redraw as if the column was never filtered.
Last Updated: 16 February 2021 18:07 -04:00 UTC Deephaven v.1.20200928 (See other versions)
Deephaven Documentation Copyright 2016-2020 Deephaven Data Labs, LLC All Rights Reserved