Formatting Tables
![]() The formatting described in this section is meant to be used with tables that will only be displayed graphically in the Deephaven console. This is because formatting adds special hidden formula columns to the table that may not be understood correctly by other tools like the CSV Writer, input table writer, etc. If you need both in the same program or script, you should save a reference to the original table before applying any formatting.
The formatting described in this section is meant to be used with tables that will only be displayed graphically in the Deephaven console. This is because formatting adds special hidden formula columns to the table that may not be understood correctly by other tools like the CSV Writer, input table writer, etc. If you need both in the same program or script, you should save a reference to the original table before applying any formatting.
Tables that will be displayed in the Deephaven console can include formatting that controls the numeric appearance of data (e.g., $ signs, percentages, decimal places, etc.) and how the color of cells, rows and columns will be rendered on the screen. Formatting is specified using Deephaven expressions, so the formatting can be dynamic or conditional depending upon the table data or other valid run-time expressions.
Several formatting methods can also be applied manually table columns in the Deephaven Console. See: Working with Tables to learn more.
Numeric Formatting
Numeric formatting can be applied to the contents of a column by using the formatColumns method.
Syntax
formatColumns("ColumnName=Decimal(`<expression>`)")
The expression used in the argument can be any of the Java DecimalFormat strings. The expression needs to be enclosed by backticks.
See table below for some common examples:
|
Action |
Sample Syntax |
Formatted Examples |
|---|---|---|
|
Format the column values to include two mandatory decimal places. |
|
123,456.78 |
|
Format the column values to dollars and cents. |
|
$123,456.78 |
|
Format the column values to reflect a percentage with two mandatory decimal places. |
|
100.11% |
Date and Time Formatting
Date and time formatting can be applied to the contents of a column by using the formatColumns method.
Syntax
formatColumns("ColumnName=Date(`<expression>`)")
The expression used in the argument can be any of the Java DateFormat strings. The two-letter timezone (e.g., NY, ET, MN, CT, HK, etc.) can be displayed by adding %t to the end of the time component (see second example below). The expression needs to be enclosed by backticks.
See table below for examples:
|
Action |
Sample Syntax |
Formatted Examples |
|---|---|---|
|
Format the column to show the day of week, month and time |
|
Wed 21 Mar 18 17:03:16 |
|
Format the column to show the time with two-letter time zone |
|
17:03:16 NY |
|
Format the column to show the full date and time with the Java time zone |
|
2018_50_80T17-03-16.0000 EDT |
Conditional formatting may be applied in the same fashion as with other types of formatting.
Custom Table/Column Tooltip Descriptions
Custom descriptions for tables and/or columns can be added using the withTableDescription() and/or withColumnDescription() methods. Descriptions will appear as tooltips when the user's cursor hovers over the respective table's tab or the column's header.
The syntax is as follows:
t.withTableDescription("<description>")
t.withColumnDescription("<colName>", "<description>")
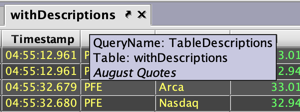
For example, the query below starts with the StockQuotes table, adds a new column (Mid), and then adds a table description and a column description to the new table.
from deephaven import *
StockQuotes=db.t("LearnDeephaven", "StockQuotes") \
.where("Date=`2017-08-25`") \
.updateView("Mid = Bid + Ask / 2")
tableDescriptions=StockQuotes \
.withTableDescription("August Quotes") \
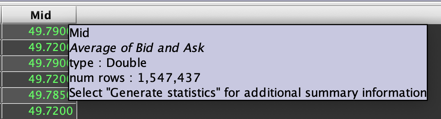
.withColumnDescription("Mid" , "Average of Bid and Ask")
StockQuotes=db.t("LearnDeephaven", "StockQuotes")
        .where("Date=`2017-08-25`")
        .updateView("Mid = Bid + Ask / 2")

tableDescriptions=StockQuotes
        .withTableDescription("August Quotes")
        .withColumnDescription("Mid" , "Average of Bid and Ask")
When the cursor hovers over the table tab, "August Quotes" appears in the tooltip:
When the cursor hovers over the Mid column header, "Average of Bid and Ask" appears in the tooltip:
Formatting Columns with Progress Bars
Column values can be displayed with a Progress Bar, which fills in the cell's background to correspond with a percentage value, thereby making it easier to quickly visualize progress.
To build a table with a column (or columns) rendered as progress bars, the query used to build the table must first import the com.illumon.iris.db.v2.ColumnRenderersBuilder class. The ColumnsRenderersBuilder class is then used to define the columns that will be reformatted in the table.
The syntax for an example query follows:
from deephaven import *

t1 = db.t("Namespace" , "TableName").where("Date=`YYYY-MM-DD`")

t2 = t1.setColumnRenderers(ColumnRenderersBuilder() \
        .setRenderer("ColName", "PROGRESS_BAR") \
        .setRenderer("ColName", "PROGRESS_BAR"))
import com.illumon.iris.db.v2.ColumnRenderersBuilder

t1 = db.t("Namespace" , "TableName").where("Date=`YYYY-MM-DD`")
t2 = t1.setColumnRenderers((new ColumnRenderersBuilder())
        .setRenderer("ColName", "PROGRESS_BAR")
        .setRenderer("ColName", "PROGRESS_BAR"))
- The first line of the query tells Deephaven where to import the class needed for the query to run properly.
- The second line of the query fetches the source table, t1.
- The third line of the query creates the t2 table by creating a new instance of the ColumnRenderersBuilder, and specifies the columns that will be rendered with progress bars. In this example, two columns are formatted individually by using the setRenderer() method. Note the PROGRESS_BAR argument works for integer data types with values from 0 to 100, or for doubles data types with values from 0.0 to 1.0.
Example
In the following example, we are starting with an existing table called histVolume, which was created to show the following for each of several tickers:
- Number of shares desired (
GoalQ) - Number of shares already purchased (
FilledQ) - Number of shares still needed to reach the goal (
NeedQ) - Progress to goal (
PercentComplete) - and three more columns for the quantity, price, and time of the last purchase for each ticker (
LastQty, LastPrice, Time).
The existing histVolume table is shown below.
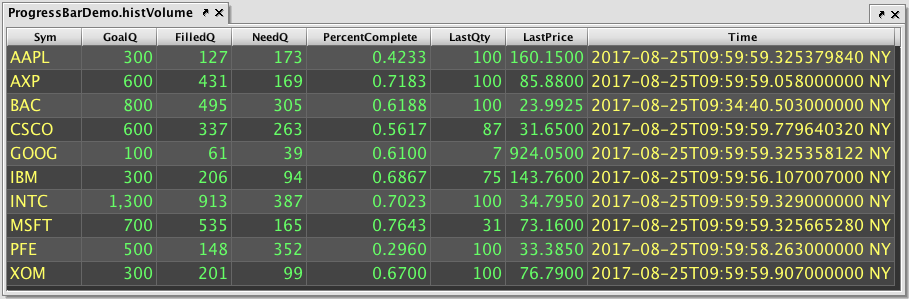
As shown above, the PercentComplete column shows a numerical value. By adding the following two lines to the query, we can also incude a visual progress bar in the background for each cell in the column.
from deephaven import *

t2 = histVolume.setColumnRenderers((ColumnRenderersBuilder()) \
    .setRenderer("PercentComplete", "PROGRESS_BAR"))
import com.illumon.iris.db.v2.ColumnRenderersBuilder
t2 = histVolume.setColumnRenderers((new ColumnRenderersBuilder())
        .setRenderer("PercentComplete", "PROGRESS_BAR"))
The first line above imports the ColumnRenderersBuilder class
The second line of the query creates the t2 table by fetching the earlier histVolume table, creating a new instance of ColumnRenderersBuilder, and specifying the column that will be rendered with progress bars. In this example, the PercentComplete column will be formatted using the setRenderer() method.
The resulting t2 table is shown below.
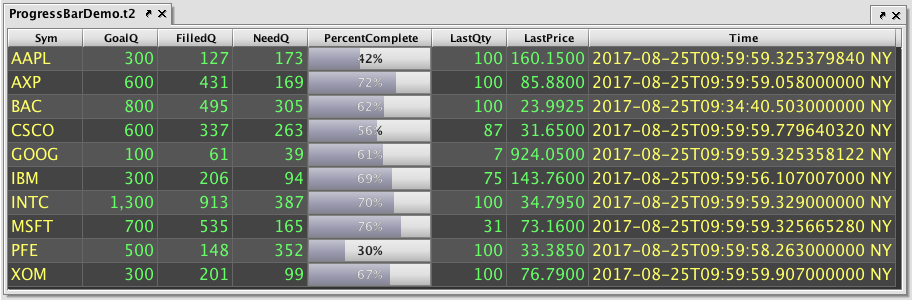
The ColumnRenderersBuilder class works on ticking tables, and will update accordingly as the underlying data changes in the table. In the example above, as more orders are filled, the values in the NeedQ column will decrease and the values in the PercentComplete column will increase.
Color Formatting
Note: The default appearance of Deephaven console features including table backgrounds, grid lines, positive/negative values, etc. is discussed in Settings: Color Chooser.
Formatting a Column with Color
Color formatting can be applied to the contents of an entire column using the formatColumns method.
Syntax
formatColumns("columnName=<colorObject>")
The columnName is the name of the column to format, and <colorObject> is any of the valid color objects available in Deephaven.
Example
The following query will apply the color VIVID_YELLOW to all cells in column C:
t2=t1.formatColumns("C=VIVID_YELLOW")
|
|
|
Conditional Formatting
Deephaven provides methods for applying conditional formatting to only certain rows and/or columns.
Conditional Formatting of Columns
The following method formats cells in the named column when a specified condition exists.
Syntax
formatColumnWhere("columnName", "<condition>", "colorValue")
Example
The following query applies the color DEEP_GREEN to column C when the value in column D of the same row is greater than 0.
t3=t1.formatColumnWhere("C", "D>0", "DEEP_GREEN")
t3
|
A |
B |
C |
D |
|
1 |
5 |
Ford |
-220 |
|
2 |
10 |
Chevy |
151 |
|
3 |
15 |
Toyota |
-192 |
|
4 |
25 |
Tesla |
447 |
Conditional Formatting in Rows
The formatRowWhere method formats entire rows when a specified condition exists.
Syntax
formatRowWhere("<condition>", "<colorValue>")
Example
The following query applies the color PALE_BLUE to any row when the value in column D is less than 0.
t4=t1.formatRowWhere("D<0", "PALE_BLUE")
t4
|
A |
B |
C |
D |
|
1 |
5 |
Ford |
-220 |
|
2 |
10 |
Chevy |
151 |
|
3 |
15 |
Toyota |
-192 |
|
4 |
25 |
Tesla |
447 |
Example
Ternary statements can also be used to color cells based on conditional statements. The following colors cells in column ABRIGHT_GREEN if they are positive and BRIGHT_RED if otherwise:
t5=t1.formatColumns("A = (D > 0) ? BRIGHT_GREEN : BRIGHT_RED")
t5
|
A |
B |
C |
D |
|
1 |
5 |
Ford |
-220 |
|
2 |
10 |
Chevy |
151 |
|
3 |
15 |
Toyota |
-192 |
|
4 |
25 |
Tesla |
447 |
Example
The following colors the entire row BRIGHT_YELLOW if column C is equal to the string "Ford"
t6=t1.formatRowWhere("C=`Ford`", "BRIGHT_YELLOW")
t6
|
A |
B |
C |
D |
|
1 |
5 |
Ford |
-220 |
|
2 |
10 |
Chevy |
151 |
|
3 |
15 |
Toyota |
-192 |
|
4 |
25 |
Tesla |
447 |
Example
The following colors all the cells in every other row VIVID_PURPLE:
t7 =t1.formatRowWhere("i % 2 == 0", "VIVID_PURPLE")
t7
|
A |
B |
C |
D |
|
1 |
5 |
Ford |
-220 |
|
2 |
10 |
Chevy |
151 |
|
3 |
15 |
Toyota |
-192 |
|
4 |
25 |
Tesla |
447 |
No Formatting
The special name NO_FORMATTING is provided to indicate that formatting should not be affected.
Combining Color Formatting Methods
Color methods can also be combined in a table.
Example
The following query colors all cells in every other row VIVID_PURPLE, and colors the cells in column C BRIGHT_YELLOW in every odd row.
t8 = t1.formatRowWhere("i % 2 == 0", "VIVID_PURPLE").formatColumnWhere("C", "i % 2 == 1", "BRIGHT_YELLOW")
t8
|
A |
B |
C |
D |
|
1 |
5 |
Ford |
-220 |
|
2 |
10 |
Chevy |
151 |
|
3 |
15 |
Toyota |
-192 |
|
4 |
25 |
Tesla |
447 |
Assigning Colors to Backgrounds and Foregrounds
The field of a cell is the background. The text/numbers showing in the cell is the foreground. Color objects can then be used with the following methods to assign individual color values or combinations to the background and/or foreground :
bg()orbackground()- These methods set the background to a specific color, but do not apply any foreground color.fg()orforeground()- These methods set the foreground to a specific color, but do not apply any background color.bgfg()orbackgroundForeground()- These methods set both the background and foreground to specific values.bgfga()orbackgroundForegroundAuto()- These methods set the background to a specific color. Deephaven automatically chooses a contrasting foreground color.fgo()orforegroundOverride()- These methods are similar tofg()orforeground(). However, when either of these methods are used, the color selected will override the highlight color that is automatically assigned when the user highlights the cell or group of cells in the Deephaven console. See note below.bgo()orbackgroundOverride()- These methods are similar tobg()orbackground(). However, when either of these methods are used, the color selected will override the highlight color that is automatically assigned when the user highlights the cell or group of cells in the Deephaven console. See note below.
Note: Overriding the foreground or background colors may result in not being able to see the highlighted content. Care in use is suggested.
Examples
The following query generates a table with an orange background using RGB values:
t9=t1.formatRowWhere("true","bg(colorRGB(255,93,0))")
t9
|
A |
B |
C |
D |
|
1 |
5 |
Ford |
-220 |
|
2 |
10 |
Chevy |
151 |
|
3 |
15 |
Toyota |
-192 |
|
4 |
25 |
Tesla |
447 |
The following query generates a table with a purple foreground using RGB values:
t10=t1.formatRowWhere("true","fg(colorRGB(102,0,204))")
t10
|
A |
B |
C |
D |
|
1 |
5 |
Ford |
-220 |
|
2 |
10 |
Chevy |
151 |
|
3 |
15 |
Toyota |
-192 |
|
4 |
25 |
Tesla |
447 |
The following query will color column C with a hot pink background and a yellow foreground.
t11=t1.formatColumns("C = bgfg(colorRGB(255,105,80),colorRGB(255,255,0))")
t11
|
A |
B |
C |
D |
|
1 |
5 |
Ford |
-220 |
|
2 |
10 |
Chevy |
151 |
|
3 |
15 |
Toyota |
-192 |
|
4 |
25 |
Tesla |
447 |
The following query generates a table with a navy blue background and automatically selects a contrasting foreground.
t12=t1.formatColumns("* = bgfga(colorRGB(0,0,128))")
t12
|
A |
B |
C |
D |
|
1 |
5 |
Ford |
-220 |
|
2 |
10 |
Chevy |
151 |
|
3 |
15 |
Toyota |
-192 |
|
4 |
25 |
Tesla |
447 |
Heat Maps
Color-based formatting can also be used to create heat maps in Deephaven tables.
Syntax
heatmap(<colName>, <minimumValue>, <maximumValue>, <minimumBackgroundColor>, <maximumBackgroundColor>)
Example: The following query will apply color to the Price column as follows:
- When the value is less than or equal to 0.00,
BRIGHT_GREENwill be used, - When the value is greater than or equal to 100.00,
BRIGHT_REDwill be used, and - an automatically interpolated color proportionally between
BRIGHT_GREENandBRIGHT_REDwill be used for all other values between 0 and 100.
t13=source.formatColumns("Price = heatmap(Price, 10.00, 100.00, BRIGHT_GREEN, BRIGHT_RED)")
|
|
|
|||||||||||||||||||||||||||||||||||||||||||||||||
|
|
|
Options are also available for heatmapFg() and heatmapForeground(). When either of these methods is used, the heatmap color pair listed in the argument is applied only to the foreground.
To learn about heat map methods that apply to Pivot Widgets, see Working With Pivot Widgets > Formatting Color.
Distinct Coloration
Colors can be applied to collections of values to create distinct and unique coloration for better visualization. Applying specific colors individually to each distinct value could be accomplished through iterative formatColumns methods. However, Deephaven offers a more convenient process using the class com.illumon.iris.db.util.DBColorUtil.DistinctFormatter.
This object works by mapping input values to a list of predetermined and unique colors.
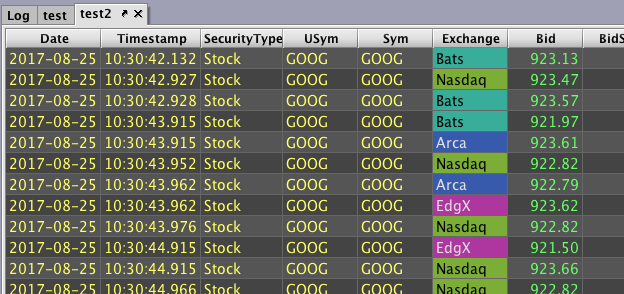
For example, the following query assigns unique colors to the values in the Exchange column. Each unique value contained in that column is mapped to its own unique predefined color; that is, no other value in the column shares the same color. Here's the query:
from deephaven import *

test = db.t("LearnDeephaven","StockQuotes").where("Date=`2017-08-25`", "Sym=`GOOG`")

#assigns an object of class DistinctFormatter to a variable named colorMe
colorMe = DistinctFormatter()

#formats the Exchange column with distinct colors
test2 = test.formatColumns("Exchange = colorMe.getColor(Exchange)")
test = db.t("LearnDeephaven","StockQuotes").where("Date=`2017-08-25`", "Sym=`GOOG`")

colorMe = new com.illumon.iris.db.util.DBColorUtil.DistinctFormatter()
// assigns an object of class DistinctFormatter to a variable named colorMe

test2 = test.formatColumns("Exchange = colorMe.getColor(Exchange)")
// formats the Exchange column with distinct colors
Combining Numeric and Color Formatting
The methods used above can also be combined by chaining the arguments to the formatColumns methods. Consider the following query:
t14 = t5.sort("Profit").formatColumns("Profit=Decimal(`###.0%`)", "Profit=heatmap(Profit, -1, 1, VIVID_RED, VIVID_GREEN)")
This query will:
- sort the table in descending order based on the values in the
Profitcolumn , - format the values in the
Profitcolumn as a percentage rounded to one decimal place, and - apply a color heat map to the
Profitcolumn ranging from vivid red to vivid green as the values of the column move from most negative to most positive.
Last Updated: 16 February 2021 18:07 -04:00 UTC Deephaven v.1.20200928 (See other versions)
Deephaven Documentation Copyright 2016-2020 Deephaven Data Labs, LLC All Rights Reserved