Linked Views
Linked Views is a feature in Deephaven that enables a user to interactively filter the content in one Deephaven table or plot based on the content selected in another Deephaven table.
To use Linked Views among tables or plots in the Deephaven console, the objects must first be "associated" to each other. One table is the source table and the other table is the target table or plot. When linking tables, a filter is applied to define the column in each table that should be linked. When a row in the source table is double clicked, the respective columns in the target table are filtered according to the filter parameters assigned during the linking process. Similarly, when a plot becomes the target of a link, the plot will instantly rechart its data according to the row clicked in the source table.
Linking Tables
To link two tables in the Deephaven console, both tables must be open in your workspace. They can be in different panels or in multiple tabbed panel sets, but they must be open and available in the console.
Note: The examples shown below use data from the LearnDeephaven namespace, including the StockTrades, StockQuotes and EODTrades tables. The following query* can be used to recreate these tables in your own console:
StockTrades=db.t("LearnDeephaven", "StockTrades").where("Date=`2017-08-25`")
StockQuotes=db.t("LearnDeephaven", "StockQuotes").where("Date=`2017-08-25`")
EODTrades=db.t("LearnDeephaven","EODTrades").where("ImportDate=`2017-11-01`")
* The query provided above assumes your system administrator has installed the tables noted and the LearnDeephaven namespace for your enterprise. Please contact your system administrator for further information.
The following example presents two tables that are nested side-by-side within the same panel. However, any tables in any panel in the console can be linked.
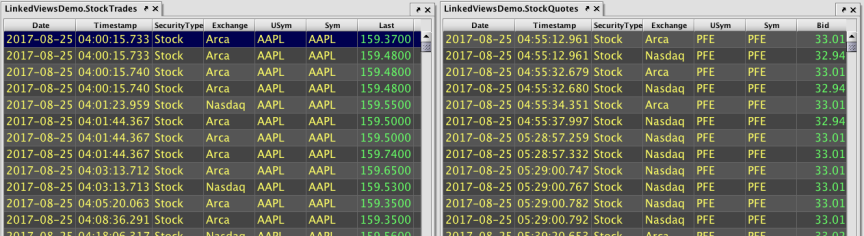
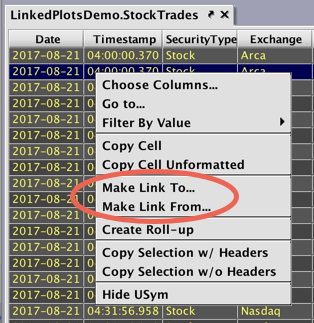
To initiate the linking process, right-click anywhere within the body of a table. The drop-down menu then presents options for Make Link To and Make Link From, as shown below:
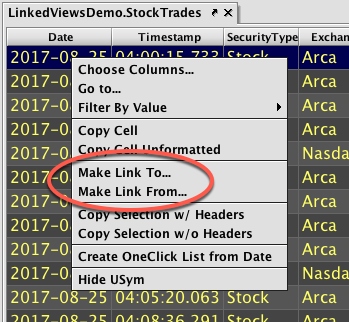
When the Make Link To option is selected, the table initially selected (in this case, the StockTrades table on the left) becomes the "source" table and the cursor will change to a link icon with a down arrow .
.
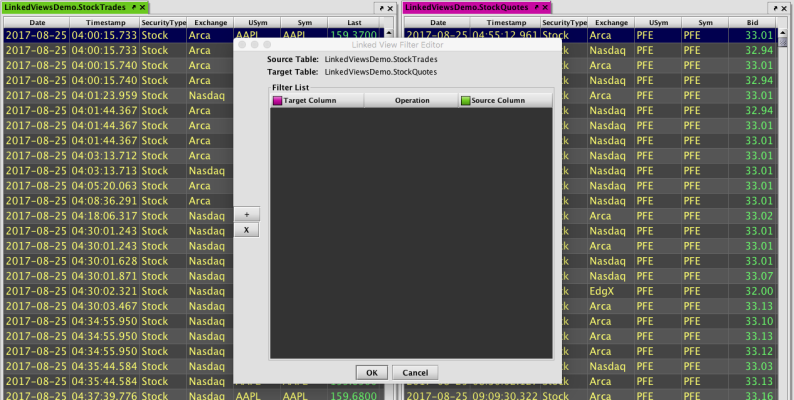
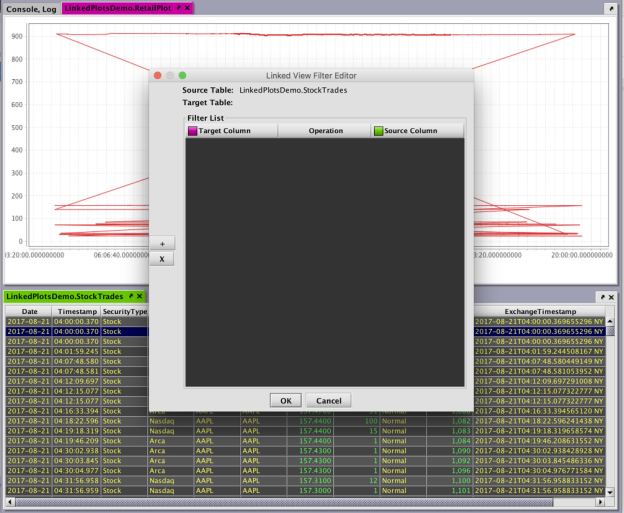
Navigate to the target table in the Deephaven console and click anywhere in the body of the table to designate it as the "target" table (in this case, the StockQuotes table on the right). When you click in the target table, the Filter Editor will open as shown below. Also, the background colors of the tables' tabs will change to signify the source and the target.
When the Make Link From option is selected, the first table selected becomes the "target" table, the cursor changes to a link icon with an up arrow , and the second table becomes the "source" table. However, the same Filter Editor opens after clicking the second table.
Adding Filter Parameters
Once both tables are selected, the Filter Editor window is used to assign the respective columns in each table that should be linked and how they should be filtered.
Click the + button located at the bottom left corner of the window to create a new filter. A new row will be added to the panel. To change Filter Editor the column names, double-click a cell. You can then choose from the available options for Target Column, Operation and Source Column.
Any column in each pair of tables may be linked, but the filter condition selected must be applicable to the data types found in both columns.
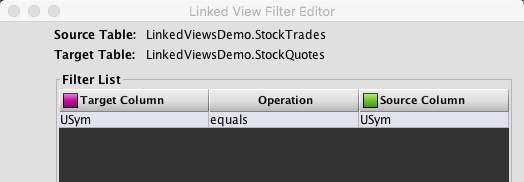
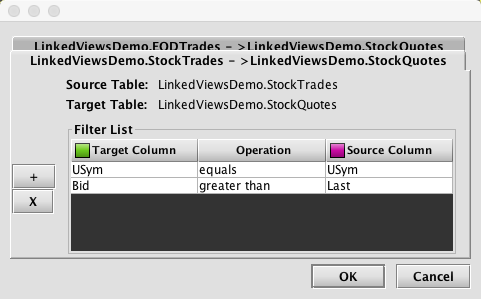
For example, if you wanted to link the tables based on the selection of one particular USym, you would select the USym column under the Target Column(s) heading and then select the USym column under the Source Column(s). Finally, select the equals option in the drop-down menu under Operation. These parameters are shown below.
The previous example shows only one pair of columns being linked. However, multiple columns can be linked between a pair of tables. To add another filter set, click the + button again, and then select the columns and the filter condition. In the following example, the Bid column is selected in the source table, the Last column is selected in the target table, and a greater than filter is selected for the Operation:
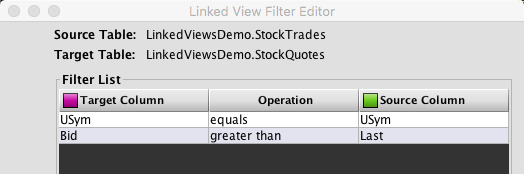
The combination of these two sets of parameters filter the target table to show content only when (a) the values in the USym columns of both tables match and (b) the value in the Bid column of the target table is greater than the value in the Last column of the source table.
Once you have added all your filter conditions, complete the linking process by clicking OK. The tables are now linked according to those parameters.
When a table has been designated as a source table, the tab for that table will show the link icon with an arrow pointing down. The tab for a table designated as a target table will show a link icon with an arrow pointing up. If a table is used as both a source table and a target table, the link icon will have one up arrow and one down arrow. See below.
|
Source Table |
Target Table |
Source & Target Table |
|
|
|
|
Filtering the Target Table
When a row in the source table is double-clicked, the target table is filtered based on the parameters specified and the value(s) in the row of the source table that was double-clicked.
For example, in the screenshot below, the highlighted row in the StockTrades (source) table has AAPL as the USym value and 159.7400 as the value in the Last column.
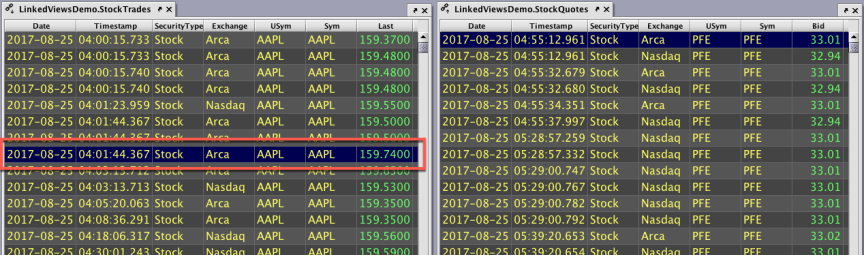
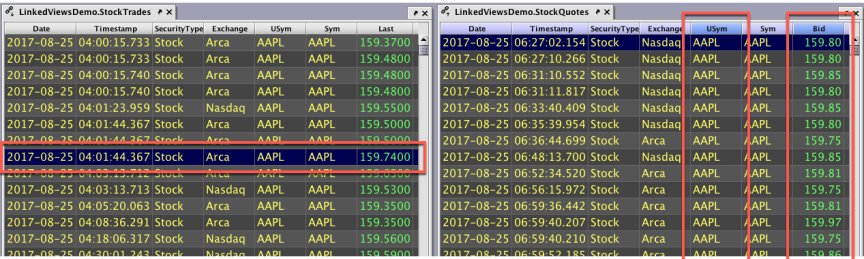
When that row is double-clicked, the StockQuotes (target) table is immediately filtered to show (a) only those rows with AAPL in the USym column and (b) only those rows where the value in the Bid column is greater than 159.7400.
If we click on a row with a different USym in the source table, the target table will then be filtered again. For example, in the screenshot below, the highlighted row in the StockTrades table has PFE as the USym value and 33.3300 as the value in the Last column.
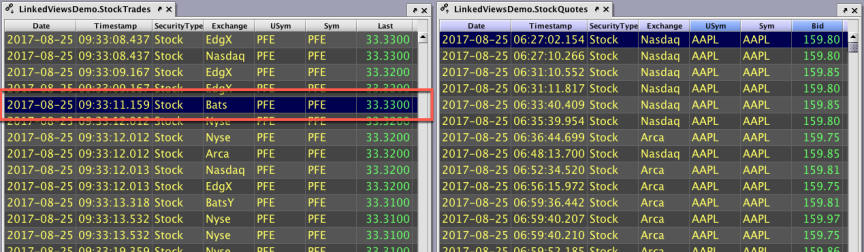
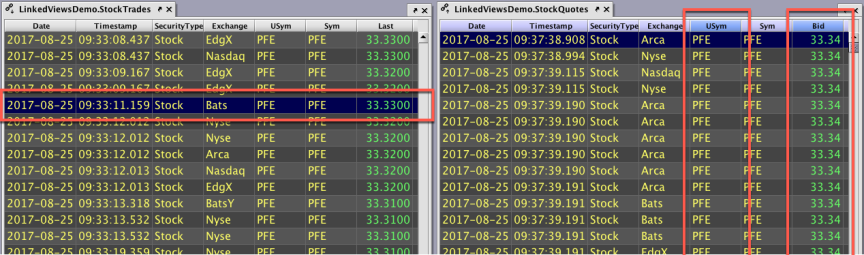
When that row is double-clicked, the StockQuotes table is immediately filtered to show (a) only those rows with PFE in the USym column and (b) only those rows when the value in the Bid column is greater than 33.3300. See below.
Edit or Remove Links
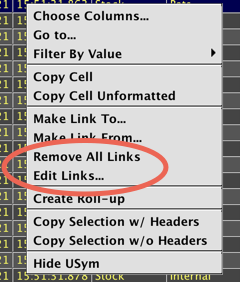
When a table is linked to another table, right-clicking in the body of either table body presents two additional options in the context menu: Remove All Links and Edit Links.
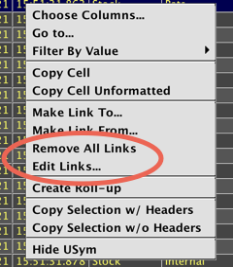
Selecting Remove All Links removes all links from the selected table to any other table(s). If any columns in the table have been previously filtered, those filters will remain activated. Note: Closing the table in the console also automatically removes any links.
Selecting Edit Links opens a dialog window that presents the filter parameters associated with the table selected. Filter parameters can be changed, added or deleted. If the selected table is linked to multiple other tables, tabs at the top of the window can be used to view/edit those other linked table filter parameters. The content in each tabbed panel is color coded to match the respective linked tables. The following screenshot shows the filter parameters for two table pairs - StockTrades & StockQuotes (in front), and EODTrades & StockQuotes (behind).
Linking Multiple Tables
The Linked Views feature enables users to link multiple tables. However, each pair of tables (source and target) is linked individually.
Any table in the Deephaven console can be the source or target for any other table as long as there are no conflicts in the filter parameters selected for each table pair.
For example, assume there are six tables named t1, t2, t3, t4, t5 and t6, as shown in the image below. Links between tables are illustrated with arrows. 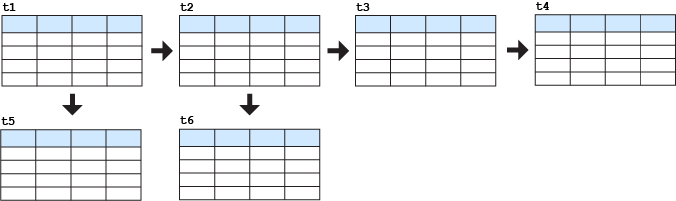
In the diagram above:
t1is the source table for two target tables,t2andt5.t2is a target table fort1, but it is also the source table fort3andt6.t3is the source table fort4t4, t5andt6exist only as target tables
Therefore, double-clicking on a row in t1 will filter t2 and t5. To filter additional tables in the sequence, you will then need to double-click a row in table t2, which will further filter t3 and t6. Finally, double-clicking in t3 will filter t4.
Careful attention needs to be taken when linking multiple tables. If certain column values have already been filtered out of a table, those values will not be available in subsequent targeted tables.
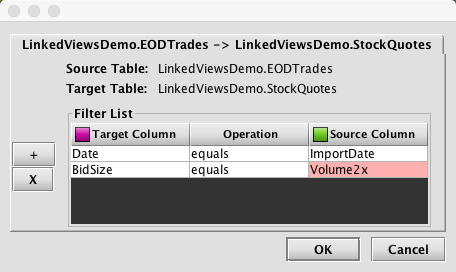
Also, if a column is deleted or renamed in a linked table, an error message will appear when the source table is double-clicked. If you select Edit Links for a table pair that includes a filter for a column that has been renamed or deleted, the Filter Editor panel will highlight the row containing the missing/changed column name. For example, in the screenshot below, the column name (Volume2x) for the source table is missing:
Linking Plots
Any OneClick dataset can be linked to a table in the Deephaven Console. In addition to being able to pair the plot with a OneClick panel, a OneClick plot can act as the "target table" in a Linked Views pair.
See also: OneClick Plotting.
The syntax for a OneClick dataset follows:
oneClick(source, "ColName1", "ColName2", …)
sourceis the table containing the data to be charted.- Additional arguments represent the name(s) of each column (as a string) to be available for filtering, either by a OneClick panel, or using the Linked View Filter Editor.
Once both the source and target objects are open in your workspace, Linked Views can be initiated using the right-click table data menu. They can be in different panels or in multiple tabbed panel sets, but they must be open and available in the console.
Note: The examples shown below use data from the LearnDeephaven namespace. The following query can be used to recreate these tables in your own console:
StockTrades=db.t("LearnDeephaven", "StockTrades")
.where("Date=`2017-08-21`")
toc = oneClick(StockTrades, false, "USym")
RetailPlot = plot("USym", toc, "Timestamp", "Last").show()
The first line of the query is the source of the data for the chart. The second line of the query applies the oneClick method to the table StockTrades and specifies the column USym should be enabled for OneClick filtering. The boolean argument false allows the chart to plot its data before a filter is applied; this is necessary to use Linked Views without a OneClick panel connected to the table. The query saves the OneClick SelectableDataSet to the variable toc. However, toc is not visible in the Deephaven console. The third line of the query creates a plot using data from the variable toc. Data in the Timestamp column is used for the X values and data from the Last column is used for the Y values. The plot will open with all the USym values plotted.
To initiate the linking process, right-click anywhere within the body of the table or plot. The drop-down menu on the source table presents options for Make Link To... and Make Link From..., as shown below:
When the Make Link To... option is selected, the table initially selected (in this case, the StockTrades table on the bottom) becomes the "source" table and the cursor will change to a link icon with a down arrow  .
.
Click anywhere within the plot to designate it as the "target table" (in this case, RetailPlot at the top of the Deephaven console window functions as the target table). The Linked View Filter Editor will open as shown below. The background colors of the table and plot's tabs will change to signify the source and the target.
The drop-down menu on the target plot will only present the option to Make Link From.... Plots can only function as a target "table."
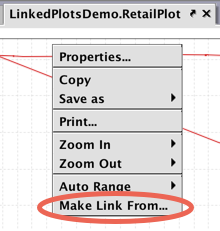
When the Make Link From... option is selected, the plot becomes the "target" table, and the cursor changes to a link icon with an up arrow . However, the same Filter Editor opens after clicking the "source" table.
As with linking tables, it is possible to possible to link one target plot to multiple source tables. However, you can only apply one filter from one source at a time.
Adding Filter Parameters
Once both the source and target are selected, the Filter Editor window is used to assign the columns that should be linked and how they should be filtered.
Click the + button located at the bottom left corner of the window to create a new filter. A new row will be added to the panel.
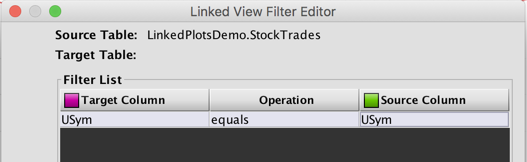
When linking plots, the only Target Column(s) available are those specified in the query. In this example, the USym column automatically becomes the Target Column and no other options are available. The Operation will be "equals" by default: this cannot be changed, as linking plots only supports equals. Double-click Source Column to see a list of the columns in the source table.
Note: The Filter Editor allows you to choose any column, however, you must choose a meaningful value or the filter operation will throw an error or result in a blank plot. You can also add multiple source columns, but the plot will load as blank unless the columns have duplicate data.
Functional parameters are shown below.
Once you have added all your filter conditions, complete the linking process by clicking OK. The objects are now linked according to those parameters.
Filtering the Target Plot
When a row in the source table is double-clicked, the target plot is filtered based on the parameters specified and the value(s) in the row of the source table that was double-clicked.
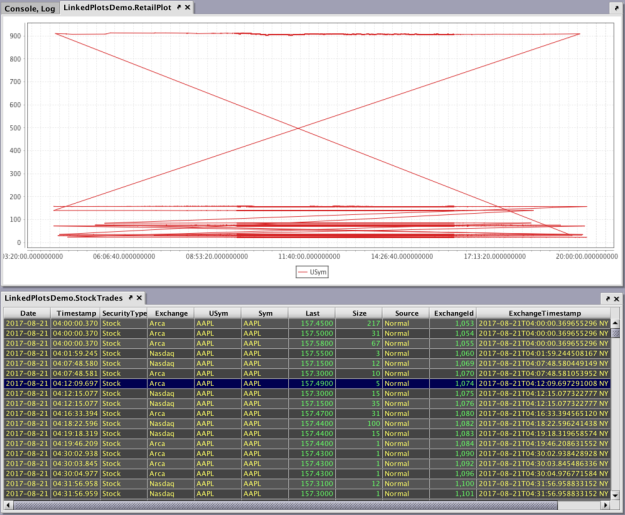
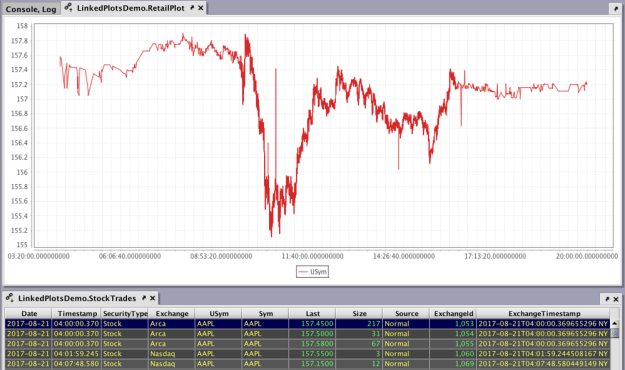
For example, in the screenshot below, the highlighted row in the StockTrades (source) table contains AAPL as the USym value. The plot immediately charts the data, and will be the same when any row with AAPL is clicked.
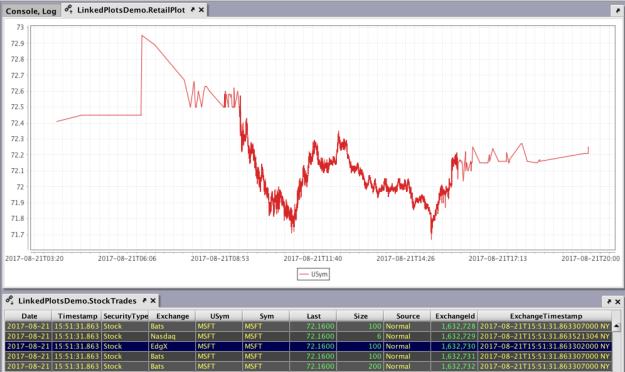
Clicking a row where the USym contains MSFT, for example, produces a new chart:
The tab for the target, RetailPlot, includes the link icon with an up arrow, while the tab for the source, StockTrades, includes the link icon with a down arrow.
Edit or Remove Links
When a table is linked to a plot, right-clicking in the source table presents two additional options in the context menu:Remove All Links and Edit Links....
Selecting Remove All Links removes all links between the source and target objects. Removing the links will not alter the current plot. Closing either the table or plot in the console also automatically removes any links.
Selecting Edit Links... opens a dialog window that presents the filter parameters associated with the object selected. Filter parameters can be changed, added or deleted, although as explained above only certain parameters will meaningfully filter the plot.
Saving Linked Views
Saving linked views in your workspace is possible only if the source table and target table/plot are generated from a persistent query. Once you have established your links and set the filter parameters, click Save at the top of Deephaven console.
Linked views generated from persistent queries will remain linked and will reestablish themselves if queries are restarted for any reason or after closing and reopening Deephaven.
Last Updated: 16 February 2021 18:07 -04:00 UTC Deephaven v.1.20200928 (See other versions)
Deephaven Documentation Copyright 2016-2020 Deephaven Data Labs, LLC All Rights Reserved