Plotting Recipes
The following charts and their respective queries are provided as samples. However, the data used to create these charts (as listed in the namespaces and table names of the queries below) is not included with Deephaven.
Additional sample charts and their recipes can be found in the Plotting section of the Deephaven Query Cookbook.
Scatter Plot Matrix
Chart
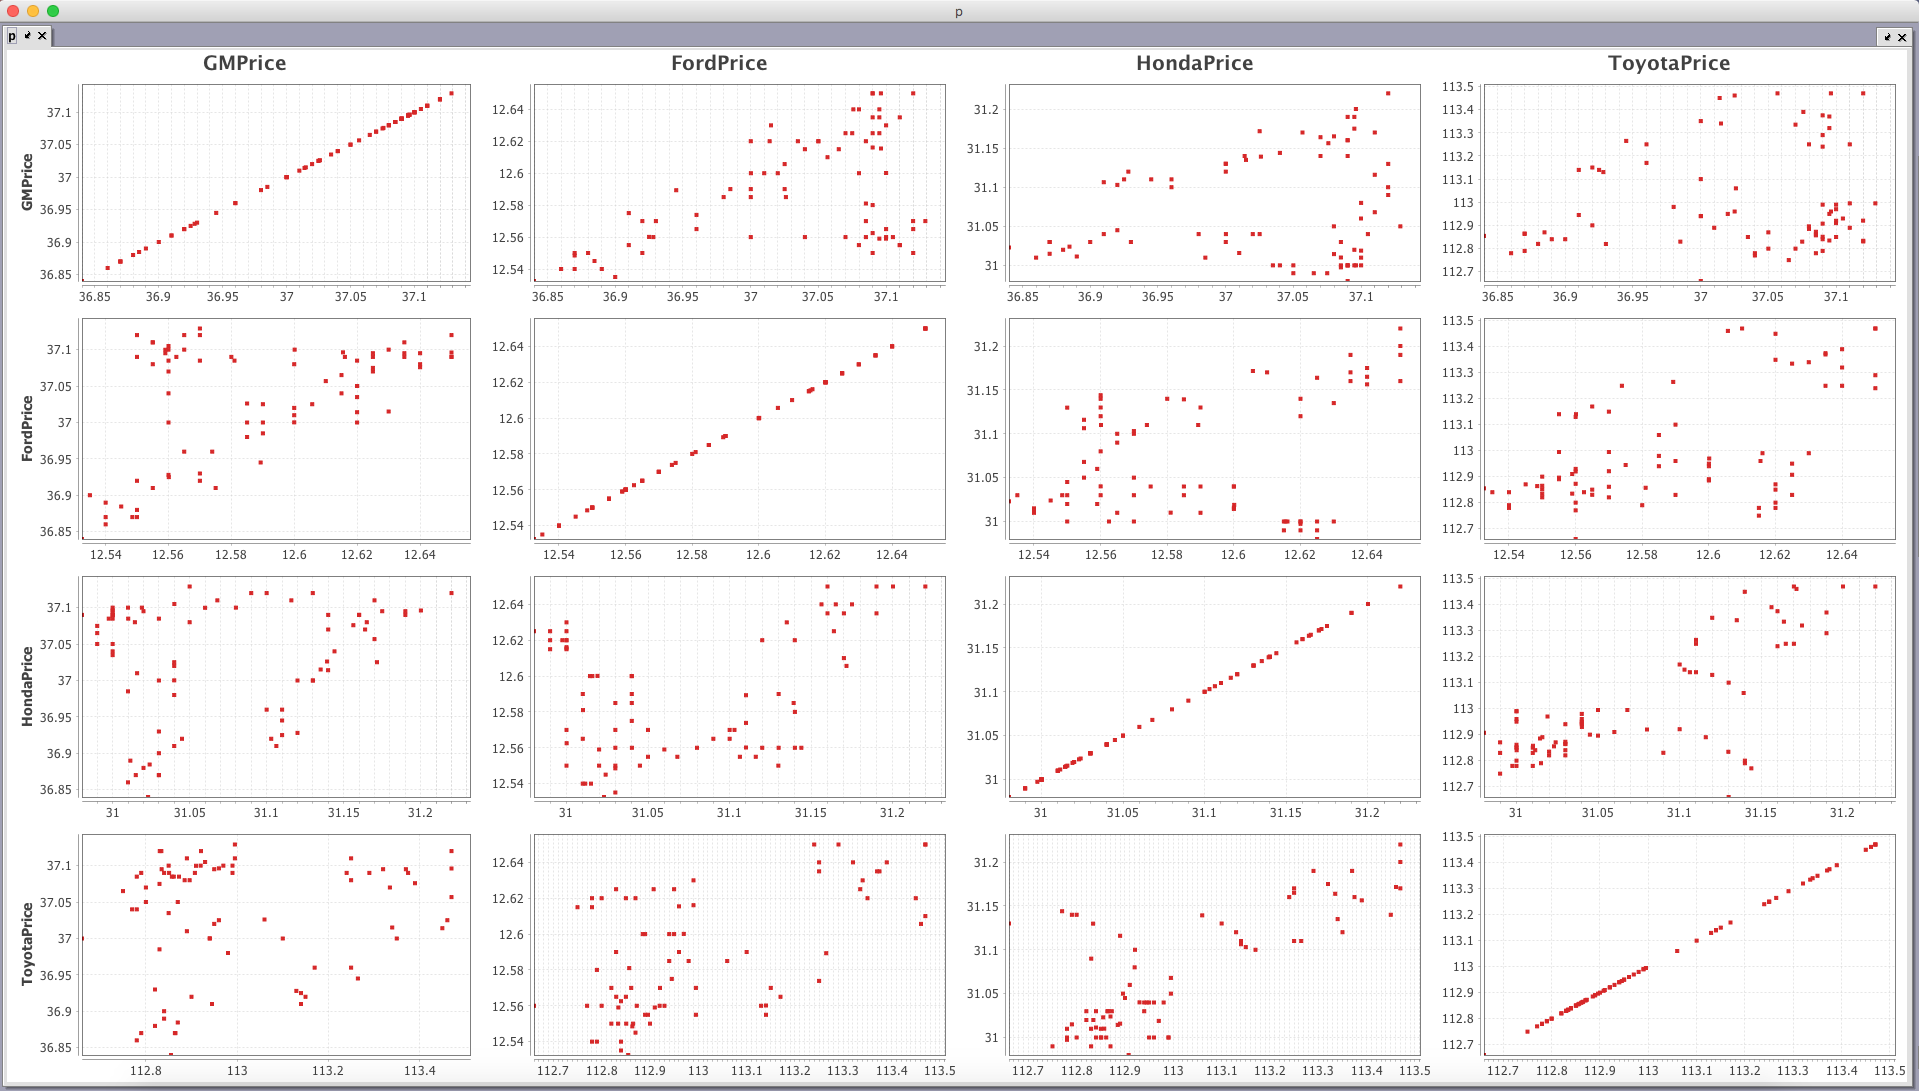
/* source the data */
tableMap = db.t("MarketUs", "TradeNbboStock").where("Date = `2017-05-04`", "Sym in `GM`, `F`, `HMC`, `TM`").view("Date", "Timestamp", "Sym", "Price").updateView("TimeBin=upperBin(Timestamp, 5 * MINUTE)").lastBy("TimeBin", "Sym").byExternal("Sym")
table = tableMap.get("F").renameColumns("FordPrice = Price").join(tableMap.get("GM"), "TimeBin", "GMPrice = Price")
table = table.join(tableMap.get("HMC").renameColumns("HondaPrice = Price"), "TimeBin", "HondaPrice")
table = table.join(tableMap.get("TM").renameColumns("ToyotaPrice = Price"), "TimeBin", "ToyotaPrice")
/* build the chart */
p = scatterPlotMatrix(table, "GMPrice", "FordPrice", "HondaPrice", "ToyotaPrice")
.pointSize(0.5)
.show()
OHLC and Volume in the same Figure
Chart
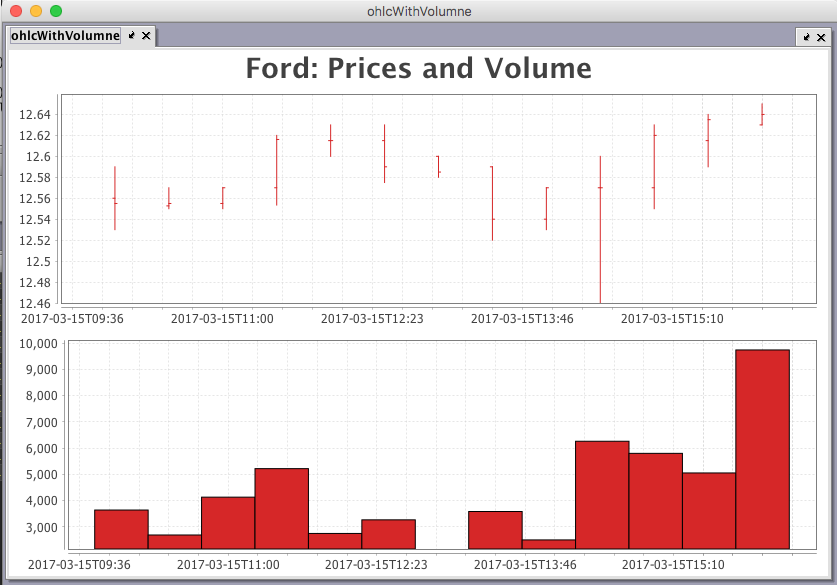
/* source the data */
fordPrices = db.t("MarketUs", "TradeNbboStock")
.where("Date = `2017-03-15`", "Sym in `F`")
.view("Date", "Timestamp", "Sym", "Price")
.updateView("TimeBin=upperBin(Timestamp, 30 * MINUTE)")
.by("TimeBin")
.where("Price.size() > 1000")
.updateView("Open = first(Price)", "Close = last(Price)", "High = max(Price)", "Low = min(Price)", "Volume = Price.size()")
xMin = DBTimeUtils.convertDateTime("2017-03-15T09:30:00.000000000 NY")
xMax = DBTimeUtils.convertDateTime("2017-03-15T16:30:00.000000000 NY")
/* build the chart */
ohlcWithVolume = figure(2,1)
.fig.title("Ford: Prices and Volume")
.newChart()
.legendVisible(false)
.newAxes()
.xRange(xMin.getNanos(), xMax.getNanos())
.ohlcPlot("Ford OHLC", fordPrices, "TimeBin", "Open", "High", "Low", "Close")
.newChart()
.legendVisible(false)
.newAxes()
.plotStyle("bar")
.xRange(xMin.getNanos(), xMax.getNanos())
.plot("Ford OHLC", fordPrices, "TimeBin", "Volume")
.show()
Last Updated: 16 February 2021 18:07 -04:00 UTC Deephaven v.1.20200928 (See other versions)
Deephaven Documentation Copyright 2016-2020 Deephaven Data Labs, LLC All Rights Reserved