Deephaven Operations Guide
Routine Procedures and Operations for Deephaven System Administrators
This document provides procedures for system administrators to meet the SLA requirements for reliable and high-performing Deephaven production deployments.
Deephaven System Overview
A production-deployed Deephaven system comprises various Network, Storage and Application components.
- The Network services include IP subnets and associated services (DNS, NTP, etc.).
- The Storage components consist of Intraday data on high speed local SSD volumes and Historical data on NFS disk mounts exported from a highly available storage system.
- The Application components are deployed across multiple nodes, where each node is a x86_64 (64-bit) Linux physical or virtual server.
For more details on deployment architecture, please refer to Scaling to Multiple Servers.
List of Deephaven Services
A Deephaven system comprises the following processes.
|
Process Name |
Run User |
Log Prefix |
|---|---|---|
|
authentication_server |
irisadmin |
AuthenticationServer |
|
db_acl_write_server |
irisadmin |
DbAclWriteServer |
|
db_tdcp |
dbquery |
TableDataCacheProxy |
|
configuration_server |
irisadmin |
ConfigurationServer |
|
iris_controller |
irisadmin |
PersistentQueryController |
|
log_aggregator_service |
irisadmin |
LogAggregatorService |
|
tailer1 |
irisadmin |
LogtailerMain |
|
db_dis |
dbmerge |
DataImportServer |
|
db_merge_server |
dbmerge |
RemoteQueryDispatcher |
|
db_ltds |
dbquery |
LocalTableDataServer |
|
db_query_server |
dbquery |
RemoteQueryDispatcher |
|
web_api_service |
dbquery |
WebServer |
|
Other Processes |
Run User |
Executable |
|---|---|---|
|
client_update_service |
lighttpd |
/sbin/lighttpd |
|
MariaDB |
mysql |
/usr/libexec/mysqld |
Troubleshooting Procedures
Deephaven is a highly robust and fault-tolerant system. In the event of temporary errors, the system is designed to retry or restart components to recover from errors without much intervention from administrators and operators.
However, even in the most controlled IT environments, failures and incidents do occur. In the event of an outage or non-recoverable error of any component making up the Deephaven system, administrators can perform the basic system checks described in this guide. These include network connectivity checks, firewall rules, configuration file settings, etc.
Administrators should be familiar with the components of the Deephaven system and how to perform basic component checks, including how to stop and start services, view log files and other component diagnostics.
Typical incidents are often caused by file permissions or other system settings that are easily resolved. If you are unable to resolve any incident with basic checks or restarts, the Deephaven Support Team is available via live chat or telephone Monday through Friday, 8 a.m. to 5:30 p.m. Eastern Time.
To improve incident resolution times, please be sure your team knows how to contact Deephaven Support. Getting Help provides detailed instructions on how to contact the Deephaven Support team via email, live chat, telephone or links within Deephaven.
Prerequisites For Performing Admin Tasks
Deephaven Operating System Users
When Deephaven is installed, three Linux users are created with the minimal operating system permissions needed to run their respective process.
|
|
OS user for running Deephaven Admin processes |
|
|
OS user for database query (read) processes |
|
|
OS user for database import and merge (read-write) processes |
SSH Terminal Access
Certain administrative tasks described in this guide require SSH terminal access to the Deephaven compute nodes. As an administrator, please ensure you have SSH access to each server node in the Deephaven cluster using your own operating system user and not any of the users created during the installation.
Sudo Access
Many administrative tasks and Deephaven commands will also require sudo for the admin user, e.g., to mount or unmount NFS file shares, edit configuration files, or set folder permissions.
Please update the /etc/sudoers file to ensure the administration user can run all commands on the system.
Deephaven Console Access
Some administrative tasks, such as adding end-users, viewing query logs or performance metrics stored in the database are done using the Deephaven Console Client GUI.
As an administrator, please ensure you have the Deephaven Console installed on your workstation. For more details on installing the Deephaven Console, please refer to Installing the Launcher.
Network Services
This section describes some basic network checks administrators should verify for a healthy cluster.
Basic Network Service Checks
System administrators need to be familiar with common Linux utilities to configure and verify that the Deephaven cluster network and associated services are functioning properly. Please refer to the Linux man pages for details on any Linux commands and services.
- Check that all servers in the Deephaven cluster have their clocks synchronized using NTP service.
- A Deephaven cluster requires high speed (Gigabit) IP network connectivity from clients and between cluster nodes. Tools such as ping, traceroute and iperf can be used to check bandwidth limits and network latency between clients and server nodes.
- Deephaven processes require connectivity to various ports on cluster nodes. The Deephaven configuration files specify the host names or IP addresses and ports used by the various Deephaven components. Administrators need to check that DNS is working correctly if hostnames or fully qualified domain names are used in config files instead of IP addresses. DNS tools such as ping, dig, nslookup, etc. can be used to verify nodes in the Deephaven cluster are able to communicate with each other.
- The Deephaven Console Client GUI installed on end-users' workstations will also require IP network connectivity to a range of ports to the server nodes. The Administrators need to check network routes and firewall settings to ensure the specified ports are open between server processes and clients. Diagnostic tools such as netstat, netcat and nmap can be used to verify port accessibility between nodes and from clients.
Table of Deephaven Process Ports
Deephaven processes listen on various TCP ports and port ranges. All ports are configurable.
TCP ports can be configured in the property files:
/etc/sysconfig/illumon.d/resources/*.prop
The default Deephaven ports and port ranges follow:
|
TCP Ports |
Component |
Process Name |
Property |
|---|---|---|---|
|
22013 |
Remote Query Dispatcher (RQD) |
db_query_server |
RemoteQueryDispatcherParameters.queryPort=22013 RemoteQueryDispatcher.workerPort=22012 RemoteQueryDispatcher.webPort=8084 |
|
30002 |
Remote Merge Dispatcher (RMD) |
db_merge_server |
RemoteQueryDispatcherParameters.queryPort=30002 RemoteQueryDispatcher.workerPort=30003 RemoteQueryDispatcher.webPort=8085 |
|
23000-24999 |
RQD Workers |
RemoteQueryDispatcher_worker_<number> |
RemoteQueryDispatcher.workerServerPorts=23000-23999 RemoteQueryDispatcher.workerServerWebsocketPorts=24000-24999 |
|
32000-32999 25000-25999 |
RMD Workers |
RemoteQueryDispatcher_worker_<number> |
RemoteQueryDispatcher.workerServerPorts=32000-32999 RemoteQueryDispatcher.workerServerWebsocketPorts=25000-25999 |
|
22021
|
db_dis |
routing_service.yml: dataImportServers: |
|
|
22020 |
Log Aggregator Service |
log_aggregator_service |
routing_service.yml: logAggregatorServers: |
|
22014 |
Local Data Table |
db_ltds |
routing_service.yml: tableDataServices: |
|
22016 |
Table Data Cache Proxy |
db_tdcp |
routing_service.yml: tableDataServices: db_tdcp: port: 22016 |
|
22023 |
Configuration Server (Centralized Schema Service, Data Routing Service and Configuration Service) |
configuration_server |
configuration.server.port=22023 |
|
9030, |
User Authentication Server |
authentication_server |
authentication.server.port.plaintext=9030 authentication.server.port.ssl=9031 |
|
9040 |
User Access Control Server |
db_acl_write_server |
dbaclwriter.port=9040 dbaclwriter.ssl.port=9041 |
|
20126
|
Persistent Query Controller |
iris_controller |
PersistentQueryController.port=20126 |
|
22021 (outbound) |
Log Tailer |
tailer1..tailerN |
This is determined by the |
|
80/443 |
Client Update Server |
client_update_service |
client-update-service.conf: server.port = 80 |
|
8123 |
Web API Service |
web_api_service |
Webapi.server.port=8123 |
|
3306 |
MySQL Database |
mariadb_server |
/etc/my.cnf: port=3306 # default |
|
2812 |
M/Monit Daemon |
monit |
/etc/monitrc: set httpd port 2812 |
Startup/Shutdown of Deephaven Processes
All Deephaven processes are started and stopped with Monit. Monit is a utility for managing and monitoring processes, programs, files, directories and filesystems on a Unix system. (Refer to https://mmonit.com/monit for more information.)
Monit Service
The Monit service itself can be checked with the following command:
sudo service status monit
If Monit is not running, it can be started with the following command:
sudo systemctl start monit
To ensure Monit starts up whenever the system restarts, use the following command:
sudo systemctl enable monit
All Monit configuration files for the Deephaven processes are located in:
/etc/sysconfig/illumon.d/monit
Deephaven Services
If any of the Deephaven processes terminates unexpectedly, Monit will restart the process automatically.
You can check which processes are running with the following Monit command:
sudo monit summary
You can check the status of all processes with the following Monit command:
sudo monit status
You can check the status of individual processes with the following Monit command:
sudo monit status <process name>
For example:
sudo monit status iris_controller
Starting and Stopping Deephaven Services
If a configuration file has been updated, the associated Deephaven processes will typically need to be restarted for the changes to take effect. One exception to this is the Deephaven Controller Process, which allows various properties to be edited without needing a restart.
Starting/Stopping Deephaven Processes
When a configuration file has been updated that requires a restart of the associated Deephaven processes, use the following commands:
To stop all the configured Deephaven processes, use the following command:
sudo monit stop all
Alternatively, individual Deephaven processes can be stopped and started with the following:
sudo monit stop <process name>
sudo monit start <process name>
For example:
sudo monit stop authentication_server
sudo monit start authentication_server
See also: List of Deephaven Services
Configuration Files
Configuration-as-Code
Configuration-as-Code is an industry best practice that promotes storing of application configuration as code within the source code repository. Configuration-as-Code is an important prerequisite to have reproducible and auditable configurations. It also makes configurations testable and easier to reuse.
This is especially important with distributed systems. Maintaining multiple services across a network of distributed systems, and keeping all their settings and configurations in sync is very hard to achieve when you have to manually configure everything by clicking through UI configuration screens.
It is therefore recommended to add the Deephaven configuration files to a version control system (VCS) such as Git. This allows updates to configuration files to be tested in a separate environment before deploying any configuration changes to your production Deephaven hosts.
Deephaven Configuration Files
The Deephaven configuration files are installed on the Deephaven server in several subdirectories under:
/etc/sysconfig/deephaven/
SymLinks
/etc/sysconfig/illumon -> /etc/sysconfig/illumon.confs/illumon.iris.hostconfig
/etc/sysconfig/illumon.confs -> /etc/sysconfig/deephaven/illumon.confs.latest
/etc/sysconfig/illumon.d -> /etc/sysconfig/deephaven/illumon.d.latest
The following section provides a brief summary of the configuration files.
M/Monit Configurations
/etc/sysconfig/illumon.d/monit/*.conf
Cron Configuration
/etc/cron.d/illumonRestart.cron
Deephaven Process Configurations
/etc/sysconfig/illumon.d/resources/*.prop
Authentication Configurations
/etc/sysconfig/illumon.d/auth/*
/etc/sysconfig/illumon.d/trust/*
Schema Configurations
/etc/sysconfig/illumon.d/schema/*/*.schema
Editing Configuration Files
Deephaven can be customized by editing the configuration files. Property files (.prop) are plain text and can be edited with any local text editor such as vi or emacs. When a configuration file is changed, the affected Deephaven processes need to be restarted.
Editing Property Files
Property files are stored in etcd.
- Export the property file from etcd
- Edit the text file locally
- Import the edited file into etcd
Edit iris-endpoints.prop
$ sudo -u irisadmin /usr/illumon/latest/bin/dhconfig --export iris-endpoints.prop
$ edit iris-endpoints.prop
$ sudo -u irisadmin /usr/illumon/latest/bin/dhconfig --import iris-endpoints.prop
Edit iris-environment.prop
$ sudo -u irisadmin /usr/illumon/latest/bin/dhconfig --export iris-environment.prop
$ edit iris-environment.prop
$ sudo -u irisadmin /usr/illumon/latest/bin/dhconfig --import iris-environment.prop
Truststore Configuration File Permissions
The truststore files are located in: /etc/sysconfig/illumon.d/trust/
File owner and group should match the following table:
|
Auth File Name |
Owner |
Group |
Permissions |
|---|---|---|---|
|
truststore-iris.p12 |
irisadmin |
irisadmin |
-r--r--r-- |
|
truststore-iris.pem |
irisadmin |
irisadmin |
-r--r--r-- |
Keystore and Authentication Configuration File Permissions
The authentication configuration files require more restrictive permissions.
These files are located in: /etc/sysconfig/illumon.d/auth/
File owner and group should match the following table:
|
Auth File Name |
Owner |
Group |
Permissions |
|---|---|---|---|
|
keystore.authserver.p12 |
irisadmin |
irisadmin |
-r-------- |
|
keystore.configuration_server.p12 |
irisadmin |
irisadmin |
-r-------- |
|
webServices-keystore.p12 |
irisadmin |
irisadmin |
-r-------- |
|
priv-iris.base64.txt |
irisadmin |
irisadmin |
-r-------- |
|
priv-merge.base64.txt |
dbmerge |
dbmerge |
-r-------- |
|
priv-superuser.base64.txt |
irisadmin |
irisadmin |
-r-------- |
Log Files
Some Deephaven processes record events, errors and other application messages in their process log files. These are plain text files that can be viewed or searched with grep, tail and other text processing utilities.
| Log Search Term Definitions | |
|---|---|
| General | |
FATAL
|
Any trace logged at log level "FATAL" should indicate that the process is beginning to shutdown due to an error. |
ERROR
|
Generally, the rate of "ERROR" level trace may be interesting, but many traces logged at this level are not critical. |
|
Lifecycle Events |
|
<process name> INITIALIZING
|
The process has begun its initialization. |
<process name> RUNNING
|
Initialization has completed, and the process is available. |
<process name> ALIVE
|
The process continues to be available, logged on a configurable cycle. |
<process name> SHUTTING_DOWN
|
The process is begging to shut down. |
| Process Specific |
|
For db_dis: |
|
|
This should occur seldom, if at all. This message generally points to a configuration issue to which DBAs should be alerted. |
|
If a high rate of warning trace messages are seen from this component (other than during tailer restarts) it may point to a system issue. |
Startup Script Log Files
These capture the stdout and stderr streams from Deephaven production processes.
This file appears in the process’s log directory, with name format process_name.log.yyyy-MM-dd, where the date is the process startup date.
This file is not rotated. Be careful with automated log cleanup for long-running processes in order to ensure that this file is not deleted while still in-use.
Application Log Files
By default, application log files for Deephaven processes are written to the following locations:
/var/log/deephaven/<Application Log Directory>/<Log Prefix>.log.current
where the Application Log Directory and Log Prefix are different for each application.
For example, to view the current log file for the Authentication Server:
cat /var/log/deephaven/authentication_server/AuthenticationServer.log.current
These log locations are defined by properties in the Deephaven property files and can be changed. The root logging directory is defined by the logroot property, which has the following default value:
logroot=/var/log/deephaven
Each process can define its own log directory, using the form logDir.<process name>=<log directory>, and allowing the <logroot> substitution to use the logroot definition as a starting directory. For example, the following property defines the authentication server's log directory:
logDir.authentication_server=<logroot>/authentication_server
The following property defines a default log directory for process names which don't have their own definitions:
defaultLogDir=<logroot>/misc
The location can be changed by passing the logDir parameter into the JVM when a process is started. For example, passing the following parameter to a process changes the application log file location to the defined value:
-DlogDir=/db/TempFiles/logs
A new log file is created every 15 minutes and the .current file is a hard link to the current log file. The initial log file will have a timestamp matching the time the process started and subsequent log files will have the 15-minute timestamp interval.
The actual log file name has a timestamp suffix. For example:
AuthenticationServer.log.2018-01-30-170000.000+0000
For example, the following files were created over a one-hour period:
AuthenticationServer.log.2018-01-30-170000.000+0000
AuthenticationServer.log.2018-01-30-171500.000+0000
AuthenticationServer.log.2018-01-30-173000.000+0000
AuthenticationServer.log.2018-01-30-174500.000+0000
To follow (tail) the current log file in a terminal, use tail command with -F, so it will retry when the new file is created at the 15-minute interval. For example:
cd /var/log/deephaven/authentication_server
tail -F AuthenticationServer.log.current
Query Worker Log Samples
Deephaven workers do not produce the files described in this section. Worker logs are sent to the Process Event Log table directly or via the RemoteQueryDispatcher, depending on the type of log event.
This has implications for monitoring system processes running as workers. Such monitoring must either be done by querying the process event log table, or by consuming binary logs that are written by the LogAggregatorService as an intermediate step.
By default, Query Workers are configured to write logs via the LogAggregationService and DataImportServer to the DbInternal/ProcessEventLog table in Deephaven.
To enable Query Worker logs to write their logs to plain text files, the following properties can be set in: /etc/sysconfig/illumon.d/resources/iris-common.prop:
RemoteQueryDispatcher.writeDatabaseProcessLogs=false
RemoteQueryProcessor.sendLogsToSystemOut=true
The following sample Query Worker log entries provide a few samples for what might be monitored here. Note that in general, monitoring worker logs is not advisable, because a lot of the content may result from user code in the query itself. However, monitoring for the expected output from well-defined queries does make sense.
[2018-02-20T23:04:19.476898-0500] - WORKER_1 - ConnectionMonitor: registering monitored connection job:1744982467/AuthServer_Client/10.128.0.38:42466->10.128.0.38:9030/CommandConnection
[2018-02-20T23:04:19.484982-0500] - WORKER_1 - Successful authentication worker8.internal/10.128.0.38 using delegate token {-1691233174684810865, service
: DelegatedAuthentication, origin: worker8.internal/10.128.0.38, tokenContext: {iris}}
[2018-02-20T23:04:19.486329-0500] - WORKER_1 - Serializing result of type java.lang.Boolean
[2018-02-20T23:04:19.486838-0500] - WORKER_1 - Sending serialized result, length=47 bytes
Java Garbage Collector Logs
Deephaven Java processes are configured to record JVM Garbage Collection (GC) statistics. For query workers, the GC statistics are recorded to the Process Event Logs. Other processes will record GC statistics to the logs directory. For example, the Data Import Server's GC log can be found at:
/var/log/deephaven/dis/db_dis.log.gc_detailed.<datetime>
where <datetime> is: <YYYY-MM-DD_HH-MM-SS>
For example:
/var/log/deephaven/dis/db_dis.log.gc_detailed.2018-02-01_13-00-42
/var/log/deephaven/dis/db_dis.log.gc_detailed.2018-02-01_20-10-06
/var/log/deephaven/dis/db_dis.log.gc_detailed.2018-02-05_10-23-15
/var/log/deephaven/dis/db_dis.log.gc_detailed.2018-02-06_18-38-27
The GC logs can be very useful to understand JVM memory usage or diagnose any memory problems.
GC Log Patterns
With default Deephaven JVM start-up parameters, there are four GC log events that should be monitored:
- Parallel young generation collections that occur very frequently (more often than once per 10 seconds), or with significant real time duration (longer than 0.2 seconds):
[GC (Allocation Failure) 2018-02-21T04:28:31.559+0000: 14.240: [ParNew: 27679K->16000K(144384K), 0.0226034 secs]2018-02-21T04:28:31.582+0000: 14.263: [CMS: 143620K->141747K(320896K), 0.4811685 secs] 168566K->141747K(465280K), [Metaspace: 36101K->36101K(1083392K)], 0.5040269 secs] [Times: user=0.55 sys=0.01, real=0.50 secs]
- Full GCs, which usually result from failures of the concurrent garbage collector or other near out-of-memory conditions:
Note that in this case, "2018-02-21T04:31:33.822+0000: 196.503: [Full GC (System.gc()) 2018-02-21T04:31:33.822+0000: 196.503: [CMS: 532358K->532883K(707840K), 0.6859044 secs] 566077K->532883K(852352K), [Metaspace: 36261K->36261K(1083392K)], 0.6864226 secs] [Times: user=0.70 sys=0.02, real=0.68 secs]System.gc()" above indicates that this was invoked by a user deliberately, although this is not a guarantee given that Java built-in libraries use the same mechanism sometimes. - Concurrent mode failures in the old generation collector:
(concurrent mode failure): 658018K->180450K(672472K), 0.5520093 secs] 786112K->180450K(816856K), [Metaspace: 36011K->36011K(1083392K)], 0.5647268 secs] [Times: user=0.69 sys=0.03, real=0.57 secs] - It may also be worth monitoring for frequency of old generation collections (CMS) to detect cases when a process is using more CPU than needed because it needs a larger heap:
You should be notified if any non-worker process is starting CMS more often than once per minute.2018-02-21T04:36:27.709+0000: 76.357: [GC (CMS Initial Mark) [1 CMS-initial-mark: 219607K(601812K)] 258670K(872660K), 0.0010968 secs] [Times: user=0.00 sys=0.00, real=0.00 secs]
Stats Driver Logs
If the Stats Driver property is enabled for a given Deephaven process, various Deephaven process statistics are recorded in the logs directory.
For example, the Data Import Server's stats log can be found at:
/var/log/deephaven/dis/db_dis.log.stats.current
The <file>.stats.current file is a hard link to the current stats file. A new stats file is created every hour.
These stats files are for debugging purposes along with the following utility script:
/usr/illumon/latest/bin/stats
-
Allows users to select individual columns of the stat logs and pipe them to
stdout. - Allows users to order and filter the stat logs columns output to meet their needs.
- Creates the output in CSV format to be used in monitoring applications.
The Stats Driver property is enabled by default for Deephaven processes. To turn off statistics, disable the property in the process configuration file as follows:
statsdriver.enabled=false
The application statistics log contains entries of the performance metrics kept for each process. These are recorded on disk in CSV format for easy import into a multitude of external performance monitoring tools. As noted under the Deephaven Performance section, the statistics are also available in the DbInternal database.
The entries are in CSV format and have the following headers: Stat,IntervalName,NowSec,NowString,AppNowSec,AppNowString,TypeTag,Name,N,Sum,Last,Min,Max,Avg,Sum2,Stdev
This data should be imported into a query-able monitoring tool to write alarms against.
Binary Log Files
Several Deephaven processes write binary log files, which contain data that will be written to tables in the DbInternal namespace. The locations of these log files are driven by properties similar to the application log files, including the logroot property.
When writing a binary log file, the application will determine the location using a three-tiered search, using the namespace and table name; the most specific result found is used as the location.
binaryLogDir.<namespace>.<table name>
binaryLogDir.<namespace>
binaryLogDir
If no location is defined for the table or namespace, the location defined by the binaryLogDir property will be used.
The default location for binary logs uses the same log root as the application logs (/var/log/deephaven), but defines a different subdirectory:
binaryLogDir=<logroot>/binlogs
Process event logs (see below) have their own subdirectory:
binaryLogDir.DbInternal.ProcessEventLog=<logroot>/binlogs/pel
Performance logs have a different subdirectory.
binaryLogDir.DbInternal.QueryOperationPerformanceLog=<logroot>/binlogs/perflogs
binaryLogDir.DbInternal.QueryPerformanceLog=<logroot>/binlogs/perflogs
binaryLogDir.DbInternal.UpdatePerformanceLog=<logroot>/binlogs/perflogs
Log File Maintenance
Customers should create a job to archive these logs based on their own internal retention policies. Deephaven recommends at least a few weeks of logs be retained in case issue troubleshooting is needed.
Deephaven Database Event Logs
Some Deephaven components can be configured to log their events to the Deephaven database tables in place of text files. This dramatically improves the ability to search through logs and find related events, especially for query workers where a user would otherwise need access to the server running the worker to view its log. The full power of the Deephaven query language is available to view these table-stored event logs, instead of only the basic text processing utilities like grep, awk, sed, etc.
For example, if you want to see the logs for worker_9, you can use the following query to view them. (Note: You will need appropriate permissions to do so.)
t=db.i("DbInternal","ProcessEventLog").where("Date=currentDateNy()","Process=`worker_9`")
Process Event Logs
| Table Namespace: | DbInternal
|
|
Table Name: |
|
|
Description: |
Records log records for configured Deephaven Processes. Rows include the classic |
|
Sample Queries
|
|
For more details on the ProcessEventLog table, please refer to DbInternal tables
Audit Event Logs
| Table Namespace: | DbInternal
|
|
Table Name: |
|
|
Description: |
Captures all Audit events such as user login attempts, process startup events, etc. Non-privileged users can only see records for which the |
|
Sample Queries
|
|
For more details on the AuditEventLog table, please refer to DbInternal Tables.
Viewing Binary Log Files with iriscat
Because Deephaven log files on disk are in binary format, an alternative way of viewing log records is to use the iriscat utility. This can come in handy when there are system errors preventing you from querying the database using the Deephaven Console GUI client.
To view binary files using iriscat first make sure that JAVA_HOME is set.
export JAVA_HOME=/usr/java/latest
Once JAVA_HOME is set you can run iriscat using this command:
/usr/illumon/latest/bin/iriscat <path to binary file>
For example:
/usr/illumon/latest/bin/iriscat
/var/log/deephaven/binlogs/test.file.bin.2018-02-02.141436.113-0800
This will display the contents of the file in CSV format. To view them in the same file as formatted text use the -l flag. For example:
/usr/illumon/latest/bin/iriscat -l <path to binary file>
Here is the full list of options for the iriscat utility:
|
iriscat Option |
Description |
|---|---|
|
|
Names of columns to display, comma-separated |
|
|
Show debugging information (row flags, column metadata) |
|
|
Index of the last row displayed |
|
|
Format date time columns, comma-separated (e.g., " |
|
|
Format output as if it were a log file (useful for |
|
|
Index of the first row displayed |
|
|
Time zone for time columns (e.g. DST or CST) |
Contributing Applications, Daemons and Services
Deephaven includes a few third-party components. For example, Monit has already been discussed in the Starting/Stopping Deephaven Services section.
These third-party components are installed on the system as prerequisites prior to performing the Deephaven installation. Examples of these components include lighttpd, python, and mariadb/MySQL. Please refer to the Deephaven Server Installation Guide for a complete list of third-party Deephaven package dependencies.
All of the license agreements, maintenance, troubleshooting and run-books for these external contributing applications, daemons and services are described in their respective and official online documentation.
Security and Access Control
Each Deephaven end-user requires a unique private key, or username and password. Users are created in the Deephaven Console. Only users with Deephaven admin rights can create new users.
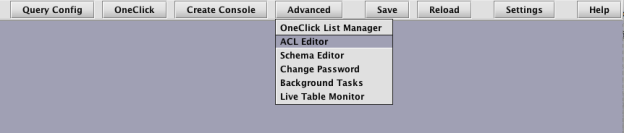
To access the ACL Editor from the Deephaven Console, click the Advanced button and select ACL Editor. (Note: A user must be a member of the acl-editors group to view or open the ACL Editor.)
Enter a new panel title if desired, or click OK to accept the default.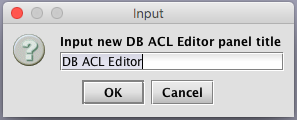
The ACL DB Editor can then be used to add or update Users, Groups and Table permissions.
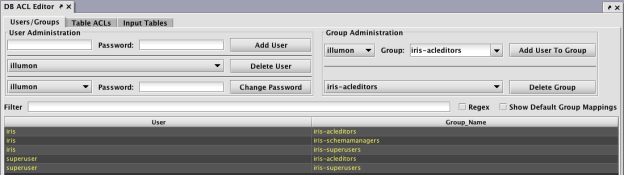
Please refer to Permissions for additional information about the ACL Editor.
MySQL vs. LDAP
By default, Deephaven user permissions are stored in a local MariaDB (MySQL) database. Alternatively, the Authentication Server allows the use of Lightweight Directory Access Protocol (LDAP) to validate usernames and passwords. This is convenient for customers who already have users in a directory server such as Microsoft Active Directory.
Please refer to the LDAP Configuration Guide for instructions on how to configure Deephaven to use LDAP instead of MariaDB (MySQL).
Metrics and Monitoring
Understanding the state of your Deephaven deployment is essential for ensuring the reliability and stability of the system. Metrics provide the raw data measurements of system usage for an external monitoring system that can gather and visualize metrics, and send out alerts.
Monitoring
Monitoring is the process of collecting, aggregating and analyzing metrics. Raw metric data from various parts of the system should be collected into a monitoring system such as Grafana, DataDog, New Relic, etc.
The monitoring system is responsible for aggregation, visualization, and initiating alerts when the values meet certain thresholds.
Deephaven Process Monitoring
Basic monitoring for all Deephaven processes can be implemented by examining the servers process list for each of the Deephaven processes listed above or by using Monit output to see the process health. In general, Monit will attempt to restart any failed processes until successful.
Alarms should be set up for any processes not running when they should be and combined with examination of the application logs to get the root cause.
Deephaven Performance and Event Information
The Deephaven DbInternal namespace provides several tables containing performance and event data that can be used for monitoring purposes. Queries can be written to analyze Deephaven's internal state and performance by using these tables. The performance records are recorded on disk in the binary logs listed below and are then processed into the database.
Although some of the Deephaven processes do not run under the irisadmin account (for example the RemoteQueryDispatcher and worker processes), their binary logs are still written to the irisadmin directory as they are sent through the Log Aggregator Service.
Binary Logs
|
Table Name |
Processes |
Log Names |
|---|---|---|
| AuditEventLog | AuthenticationServer
DbAclWriteServer PersistentQueryController RemoteQueryDispatcher Workers (RemoteQueryProcessor) |
/var/log/deephaven/binlogs/DbInternal.AuditEventLog.System.<internal partition>.<date>.bin.<date.timestamp> |
| PersistentQueryConfigurationLogV2 | PersistentQueryController | /var/log/deephaven/binlogs/DbInternal.PersistentQueryConfigurationLogV2.System.<internal partition>.<date>.bin.<date.timestamp> |
| PersistentQueryStateLog | PersistentQueryController | /var/log/deephaven/binlogs/DbInternal.PersistentQueryStateLog.System.<internal partition>.<date>.bin.<date.timestamp> |
| ProcessEventLog | RemoteQueryDispatcher Workers (RemoteQueryProcessor) | /var/log/deephaven/binlogs/pel/DbInternal.ProcessEventLog.System.<internal partition>.<date>.bin.<date.timestamp> |
| QueryOperationPerformanceLog | Workers (RemoteQueryProcessor) | /var/log/deephaven/binlogs/perflogs/DbInternal.QueryOperationPerformanceLog.System.<internal partition>.<date>.bin.<date.timestamp> |
| QueryPerformanceLog | Workers (RemoteQueryProcessor) | /var/log/deephaven/binlogs/perflogs/DbInternal.QueryPerformanceLog.System.<internal partition>.<date>.bin.<date.timestamp> |
| UpdatePerformanceLog | Workers (RemoteQueryProcessor) | /var/log/deephaven/binlogs/perflogs/DbInternal.UpdatePerformanceLog.System.<internal partition>.<date>.bin.<date.timestamp> |
| WorkspaceData | WorkspaceHelper worker (RemoteQueryProcessor) | /var/log/deephaven/binlogs/DbInternal.WorkspaceData.System.<internal partition>.<date>.bin.<date.timestamp> |
Log-Related Properties
Logging of the main processes is handled through a standard set of properties. Properties are defined by <property prefix>.<property name suffix>. The property prefixes enables default values to be supplied for all processes, with overrides for individual processes. Each property can be defined multiple times, and when a process starts the appropriate values will be found and used. Prefixes are defined and searched for in the following order:
- Process name - the name of the process, as defined by the
process.nameproperty passed in to the process. For example, the query server is usually defined asdb_query_server. This is the most specific level at which a property can be defined. - Main class name - the main class that is used for the process, defined by the call to the JVM. For example, the query server runs the
RemoteQueryDispatcherclass. - IrisLogDefaults - if a property is not found with the process name or main class name prefix, the prefix
IrisLogDefaultswill be used.
An example of searching for a property is given after the list of properties presented below.
The following is a list of all the properties that can be defined for the processes. The default value is in iris-defaults.prop and can be changed in any configuration by updating the default configuration file.
|
Property Name Suffix |
Explanation |
Default Value |
|---|---|---|
|
aliveMessageSeconds |
If defined to a value greater than zero, an alive message will be written to the event logs periodically, with the interval between messages defined (in seconds) by this value. |
0 (no keepalive message) |
|
binaryLogTimeZone |
Defines a time zone ID to be used in the creation of binary log filenames. |
<none - uses the system's default time zone> |
|
captureLog4j |
Defines whether to capture |
true |
|
captureSyserr |
Defines whether or not to capture system error writes from the process and write it to the event logs, including the |
false |
|
captureSysout |
Defines whether or not to capture system output writes from the process and write it to the event logs, including the |
false |
|
logLevel |
Defines the level of messages that are written to the event logs. This applies to both the text logs and the |
INFO |
|
useLogAggregatorService |
Whether to write audit event logs and process event logs through the log aggregator service. This must be set to true if multiple instances of the same class will run on a server. |
false, except for the query workers and remote query dispatcher |
|
useMainClassNameForLogs |
If this is true, the class name is used when writing log files; otherwise the process name is used. While most times the class name is sufficient, defining this to false can be useful in cases where the same class runs for multiple processes, such as the |
true |
|
writeDatabaseAuditLogs |
Defines whether or not to write audit events to Deephaven. A standard set of audit events is provided; see the Standard Log Messages section below. |
false, except for the authentication server, Deephaven controller, ACL write server, query workers and remote query dispatcher |
|
writeDatabaseProcessLogs |
Defines whether or not to write process events to Deephaven. A standard set of audit events is provided; see the Standard Log Messages section below. |
false, except for the query workers and remote query dispatcher |
For example, the query server will look at the following properties to determine whether to write database audit logs. Once a matching property is found, that value is used. This allows the definition of the property at the individual process level (e.g,. db_query_server vs db_merge_server), the class level (in this case the RemoteQueryDisptacher class runs both the query and merge servers), and at a default level.
db_query_server.writeDatabaseAuditLogsRemoteQueryDispatcher.writeDatabaseAuditLogsIrisLogDefaults.writeDatabaseAuditLogs
By default, all binary logs are written to the binlogs subdirectory under the root directory, usually resolving to /var/log/deephaven/binlogs. See Log Files for details on changing this location.
Log Levels
The following log levels can be defined in the logLevel property:
- FATAL - Any message logged at this log level should indicate that the process is beginning to shutdown due to an error.
- ERROR - A message of this level indicates that an error has occurred, but these errors may not be critical. Examples of error-level messages include failed connections and authentication issues.
- WARN - These are warning messages which may indicate a possible issue with the application, but not generally a problem that directly affects operation.
- INFO - These indicate informational-level messages, typically for operations such as successful connections to remote servers.
- DEBUG - This log level is for debugging-level messages. Messages of this level will not usually be visible in production logs.
Standard Log Messages
All processes will have a standard set of messages that are logged. They are defined as follows.
Text Messages
The following text messages will be written. If the process is configured to write to the Process Event Log, then they will also be written there.
<process name> INITIALIZING- The process has begun its initialization.<process name> RUNNING- Initialization has completed, and the process has entered normal running state.<process name> ALIVE- If the aliveMessageSeconds property indicates to write alive messages, then this message will be written to the event logs at the specified interval. It means that the process continues to be available, logged on a configurable cycle<process name> SHUTTING_DOWN- This indicates the process is terminating.
Audit Event Log Messages
If a process is configured to write to the Audit Event Log, then a standard set of audit events will be written. Some processes provide additional audit events. Following is a list of the standard values in the Event field; the values have the same meaning as the text entries with the same names explained above. Alive messages are not written to the Audit Event Log.
INITIALIZINGRUNNINGSHUTTING_DOWN
Data Import Server Log Message Definitions
Rejecting and closing channel- This should occur seldom, if at all. This message generally points to a configuration issue to which DBAs should be alerted.DataImportStreamProcessor-.+WARN- (regex) If a high rate of warning trace messages are seen from this component (other than during tailer restarts) it may point to a system issue.
Monitoring Process Startup Logs
The application startup logs contain the initial start of the Deephaven java services for each process. Due to these commands producing output to standard out, these logs contain only the start-up commands and any failures before the process is actually running.
Alarms should be raised if the logs contain any message containing the word 'FATAL' or 'ERROR'.
Any change or modification would indicate an application restart is needed. Several alarms over time would indicate repeated process start failure.
Common Startup and Shutdown Logging
Most or all Deephaven processes use an internal library for logging their lifecycle, which can be monitored externally. Monitoring tasks can look for the following strings:
EventLogProcessName INITIALIZING- This is logged very early in startup, as the logging framework is initialized.ProcessMainClassNamestarting up - This is also logged very early, as part of the environment is initialized.EventLogProcessName RUNNING- This is logged when process-specific initialization is complete and the process is ready.ProcessMainClassName shutting down- This is logged when the environment shutdown is triggered.EventLogProcessName SHUTTING_DOWN- This is logged as one of the initial operations during shutdown processing.
Shutdown processing has a little more structure to it, if that is necessary to monitor. Each process has three ordered groups of shutdown tasks, denoted first, middle, and last. The logging around this process looks like:
Initiating shutdown processingStarting to invoke FIRST shutdown tasksDone invoking FIRST shutdown tasksStarting to invoke MIDDLE shutdown tasksDone invoking MIDDLE shutdown tasksStarting to invoke LAST shutdown tasksDone invoking LAST shutdown tasksFinished shutdown processing
During shutdown processing, Deephaven processes attempt to log as much usable information as possible in order to report on exceptional conditions or errors during cleanup, although this becomes error prone as the logger framework itself must ultimately be shutdown during the last phase, truncating some of the final messages.
Monitoring Process Run Logs
The application run log contains entries of the current activity of the given process. The entries in the run logs are categorized into: DEBUG, INFO, WARNING, ERROR, and FATAL.
Alarms should be raised if the logs contain:
- Any message containing the word '
FATAL' - Any message containing the word 'shutdown'
Statistics that may be useful:
- Log entries per time interval
ERRORlog entries per time interval- Ratio with total log entries
- Startup/Shutdown messages
Monitoring the Data Buffer Pool
The DataImportServer, LocalTableDataServer, TableDataCacheProxy, and query worker processes (including those used for merge) all operate around an internal pool of 64KB binary buffers used to read, write, and cache binary data. While buffer size is technically configurable, it must be globally consistent for the entire data pipeline, and Deephaven has found that 64KB strikes a good balance between read/write throughput and read/cache amplification.
This pool is highly configurable.
See the JavaDocs (com.illumon.iris.db.util.caching.redesign.DataBufferConfiguration) for documentation of the options available.
Most processes only adjust the total size of the pool, which is controlled by one of the following properties (or by the Data Memory Ratio field for a Persistent Query:
DataBufferPool.sizeInBytes(deprecated in Deephaven v1.20200331 and after)DataBufferConfiguration.poolSize- allows more fluent specification, e.g. 24g, rather than simple a raw number of bytes
Pool sizing is very important for cache performance in workers, especially for the merge operations that re-write intraday data in a historical format.
Pool sizing is even more important at DataImportServer instances. A DIS must be able to allocate one buffer per column file per for each open partition (i.e., partitions with a connected tailer). If a DIS cannot make progress because it has completely exhausted the buffer pool, and it cannot free up any buffer space with a synchronous cleanup, the process will terminate.
Key log lines to look for:
AutoReclaimingObjectPool-DataBufferPool: Failed to take() an item for thread=<thread name>, initiating synchronous cleanup
This means a thread was unable to acquire a buffer in a lock free manner, and will wait and attempt to reclaim space on the current thread. It generally means that the pool is under pressure, and may indicate that the configuration should be changed to increase the pool size or the frequency and aggressiveness of concurrent cleanup.AutoReclaimingObjectPool-DataBufferPool: Unable to take() an item for thread=<thread name>, yielding (<#>/<#>)
This means that a thread was unable to acquire a buffer even after performing synchronous cleanup. This means that all buffers are actively in use and none could be freed. The thread will yield the CPU in order to allow other threads to make progress and hopefully release one or more buffers.AutoReclaimingObjectPool-DataBufferPool: Unable to take() an item for thread=<thread name> after <#> yields
This means that a thread was unable to acquire a buffer after multiple attempts to synchronously clean up and yield the CPU. This is a fatal error, and will be followed by anObjectPoolExhaustedErrorwith messageAutoReclaimingObjectPool-DataBufferPool: Yield limit encountered - no pooled objects available!
Subsequent threads that might encounter this scenario during shutdown will instead throw anObjectPoolExhaustedExceptionwith messageAutoReclaimingObjectPool-DataBufferPool: Yield limit previously encountered - no pooled objects available!
Monitoring TableDataException Logs
Many errors in reading data will result in a log message including a TableDataException. While these will often occur in workers, it may be worthwhile to monitor for them in all system processes that are part of read flow in the data pipeline, i.e., DataImportServer, LocalTableDataServer, TableDataCacheProxy.
Generally these will include the name of the service that could not provide data, an explanation of the exception, and details that may aid in investigations. They almost always point to a problem in the system, either due to data buffer pool exhaustion, invalid caches due to data deletion outside of Deephaven-internal mechanisms, software issues, or underlying issues with hardware or file systems.
The key to investigating these issues and reaching a speedy resolution is checking the logs of the process that originated the chain of errors. Often for intraday data reads, this is the DataImportServer.
Resolving cache invalidity issues, which often show up as failures to read an offset past the end of a file, usually requires a restart of the impacted processes. This typically means the DIS or LTDS serving the data, any intervening TDCPs, and the query worker(s) accessing the data.
An example of such an error follows:
Caused by: com.illumon.iris.db.v2.locations.TableDataException: RemoteTableDataService-Remote_db_ltds: Received rejection for request (requestKey=12279): FileDataBufferStore[OffsetFileAccessor[LocalFileAccessor[/db/Intraday/Namespace/TableName/IntradayPartition/2019-04-08/TableName/Symbol.dat],131072]]: Read failure: startOffset=0, minimumLength=6872, localSize=6872, size=6872, bufferIndex=0, minimumLimit=6872, sizeImpliedLimit=6872, requiredLimit=6872
Monitoring Schemas
At startup, the DIS reads schemas from the configuration service, and loads listener classes needed to parse binary log data received from tailers. If the schema or a listener for a tailed data stream changes while the DIS is running, that stream will stop receiving updates. The details of the problem will be listed in the DIS and tailer logs, and will usually be in the form of IllegalStateExceptions, RuntimeExceptions, or IllegalArgumentExceptions stating that a column did not match a name, did not match a type, or was not found, or that the version number of a binary log file did not match the version numbers of available listener classes.
Correcting such a situation may require:
- Deploying updated schema
- Regenerating loggers and listeners
- Updating remote loggers to use latest schemata and logger classes
- Restarting loggers
- Restarting the DIS process(es)
The most common scenario is that schemas must be deployed, the DIS needs to be restarted, or the schema change needs to be properly managed to not happen intra-partition.
Log messages related to this will generally include text along the lines of:
Channel handling error while processing stream: java.lang.IllegalArgumentException: Unknown column
This means that a column in the data received from the tailer is not found in the schema that the DIS has available to it. Likely needs to be resolved with a schema deployment.Channel handling error while processing stream: java.lang.RuntimeException: Can not find schema Listener element
This means the DIS cannot find the listener code; either it was not deployed, or the DIS must be restarted to find it.Channel handling error while processing stream: java.lang.IllegalStateException:
Often this is going to be an error wherein some binary log files for a partition were written with a newer schema version, and cannot be imported to the same partition without manual intervention.
That said, not all channel handling errors are of severe nature; the impact depends on the nature of the error and the importance of the data.
Metrics
Host Metrics
The Operating System records metrics about the usage of the host's underlying physical resources, such as disk space, CPU load, swap usage, etc.
Host metrics are important to evaluate the health or performance of an individual machine, regardless of the Deephaven components and services. The host metrics that should be collected are mainly comprised of usage or performance of the operating system or hardware, such as:
- CPU
- Memory
- Disk space
- Processes
Collecting these metrics will determine a node's health and ability to perform meaningful work in your Deephaven cluster.
General Host Metrics
- General System Health
- CPU errors
- Memory errors
- SAR data collection or similar for historical performance trending
- Status of all disk drives and/or built-in RAID including battery cache
- CPU Utilization
- Usage break down:
%user,%system,%idle,%iowait - Any blocked processes or any in IO Wait
- System load
- Usage break down:
- Memory/Swap Utilization
- Any swap utilization should raise an alarm
- Disk Utilization
- Root disk (/)
- General Deephaven database disk (
/db) - Deephaven Intraday disk utilization (
/db/Intraday) - Deephaven Historical disk utilization (
/db/Systems) - Data Import Server (DIS) or any servers performing batch data imports.
- All hosts in the Deephaven cluster or storage server itself
- Network Utilization
- Bandwidth utilization of network interfaces
Deephaven Metrics
Deephaven also records many metrics and events about the internal workings of the system. These metrics cover performance, audit events, system state, etc.
Deephaven metrics are stored in the Deephaven database and can be queried just like any other Deephaven table.
Performance Metrics
Deephaven Query Performance Metrics are recorded in the following tables:
- QueryPerformanceLog
- QueryOperationPerformanceLog
- UpdatePerformanceLog
| Table Namespace | DbInternal
|
|
Table Names |
QueryPerformanceLog, QueryOperationPerformanceLog, UpdatePerformanceLog |
|
Description |
Records a large variety of performance metrics about Deephaven queries, including timing measures, memory usage, duration, as well as information about the client. |
|
Sample Queries // Show QueryPerformanceLog records for today for specified user
|
|
Status Metrics
Deephaven Status and Configuration logs are recorded in the following tables:
- PersistentQueryConfigurationLogV2
- PersistentQueryStateLog
| Table Namespace | DbInternal
|
|
Table Name |
PersistentQueryConfigurationLog |
|
Description |
Records configuration and state of Persistent Queries along with any exceptions or errors the query may have encountered. |
|
Sample Queries // Show PersistentQueryStateLog records for today for specified query |
|
Alerts
Alerting is part of the monitoring system that performs actions based on changes in metric values. The main purpose of alerting is to bring human attention to investigate the current status of your systems. Monitoring systems integrate with Slack, Email, SMS and other communication mechanisms.
Critical Email Alerts
Deephaven does some internal monitoring and will send email alerts for certain critical errors, such as when Garbage Collection is taking too long, or a reporting job is hung, etc.
Administrators should configure the appropriate email address as to where these critical errors are sent. This could be to an internal group email address or the email can be submitted directly into your monitoring system.
Edit the following properties in the iris-common.prop file:
|
Prop File Path |
/etc/sysconfig/illumon.d/resources/iris-common.prop
|
|
|
Property |
|
E.g., E.g., |
Administrating and Monitoring Web Server
The Data Import Server (DIS) is used to ingest real-time data into Deephaven. At any given time, it can be handling many different real-time data feeds, and it can be useful to be able to view these feeds and where they originated from. The Remote Query Dispatcher (RQD) launches all query workers, and handles connections from various clients such as Deephaven controllers and consoles. Visibility into these operations can help an administrator understand current load.
Both the DIS and RQD can provide their current status through built-in Web servers. These options are turned off by default and must be enabled by changing the appropriate properties (see the Properties section below for details on how to do this).
To connect to a Web service, connect to the appropriate port on the server. If the Web service is configured to require SSL, use "https"; otherwise use "http". Depending on the configuration, a password may be required.
For example, if the Data Import Server is running on dataimportserver.host with SSL on port 8086 (its default), its Web server can be accessed from a browser with:
https://dataimportserver.host:8086/
If the Remote Query Dispatcher is running on remotequerydispatcher.host on port 8084 (its default), its Web server can be accessed from a browser with:
https://remotequerydispatcher.host:8084/
Authentication
The Web servers can be optionally configured to require authentication; if this is not turned on, then anybody with access to the server and port can see the details.
If authentication is turned on, then the Web service will use the Deephaven Authentication Server to determine if the user is an authorized Deephaven user. Once this is confirmed, the user's ACLs will be checked.
Configuring ACLs
The ACLs used to validate whether an authenticated user is allowed to access a Web server can be configured with the Deephaven ACL Editor. If a user is a member of the appropriate group or is a superuser, then the user can access the Web server. A user can be allowed to view all Web servers or only a specific one by making them a member of one or more of the following groups.
iris-Webviewers- a member of this group can access any of the available Web servers.<Service name>.iris-Webviewers- a member of this group can access that service's Web server.DataImportServer.iris-WebviewersRemoteQueryDispatcher.iris-Webviewers
Web Servers
Each Web server provides different status pages. It will first show a home page, and the user can click on the available options to see further details.
Data Import Server (DIS)
The Data Import Server provides two options: Server Configuration and Tailer Connections.
Server Configuration
The example screenshot below shows the configuration with which the DIS was started.
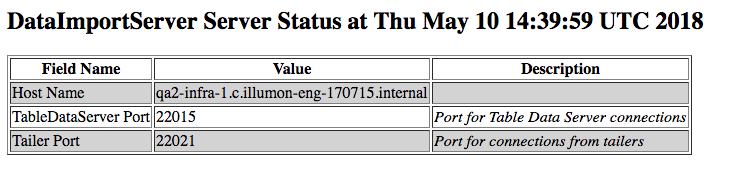
The following columns are displayed.
- Field Name - the name of the server configuration field
- Value - the value for the field
- Description - a brief description of the field, if available
Tailer Connections
The example screenshot below shows the current tailer connections (i.e., every tailer connection for which this DIS is processing data). Every connection is specific to a namespace/table/column partition value/internal partition value.
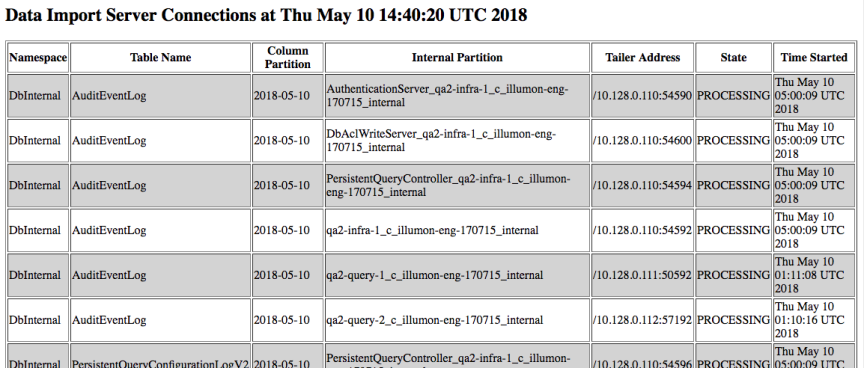
The following columns are displayed for each tailer connection.
- Namespace - the connection's namespace
- Table Name - the connection's table name
- Column Partition - the connection's column partition value, frequently the date
- Internal Partition - the connection's internal partition value
- Tailer Address - the IP and port of the remote tailer
- State - the current state of the connection:
-
NEW- a new connection has started but is not running -
REGISTERING- a new connection is registering -
INITIALIZING- a new connection is initializing -
PROCESSING- the connection is processing
-
- Time Started - the time this connection was started
Remote Query Dispatcher
The Remote Query Dispatcher provides three options: Server Configuration, Usage and Job Queue.
Server Configuration
This shows the configuration with which the DIS was started.
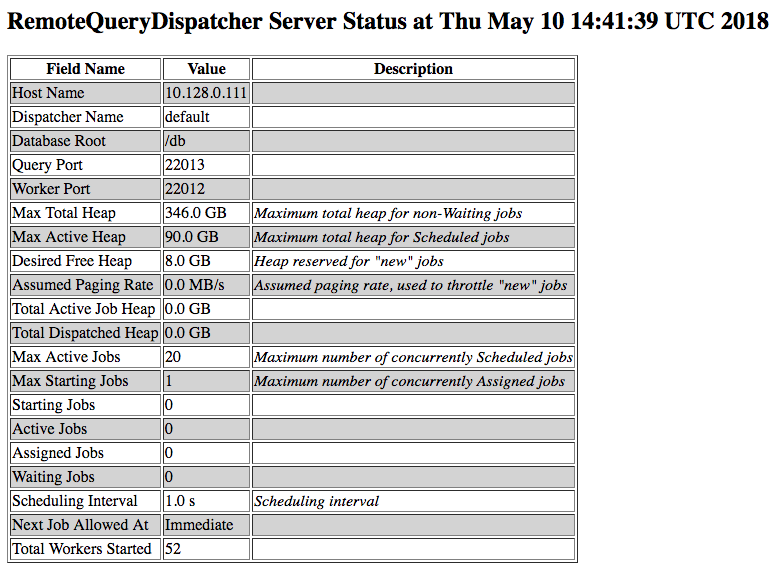
The following columns are displayed.
- Field Name - the name of the server configuration field
- Value - the value for the field
- Description - a brief description of the field, if available
Usage
This shows the active client connections to the dispatcher. These will usually indicate Deephaven controller or console processes.
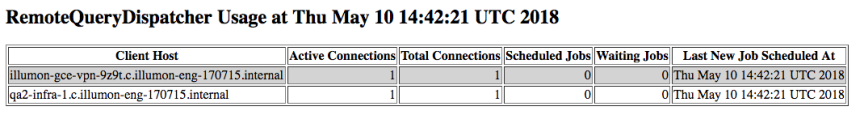
The following columns are displayed.
- Client Host - the host name of the client
- Active Connections - the number of active connections for this host
- Total Connections - the total number of connections received for this host
- Scheduled Jobs - the number of jobs (workers) scheduled (running) for this host
- Waiting Jobs - the number of jobs (workers) waiting to be started for this host
- Last New Job Scheduled At - the last time a new job was scheduled
Job Queue
This displays the active jobs (i.e., worker processes).
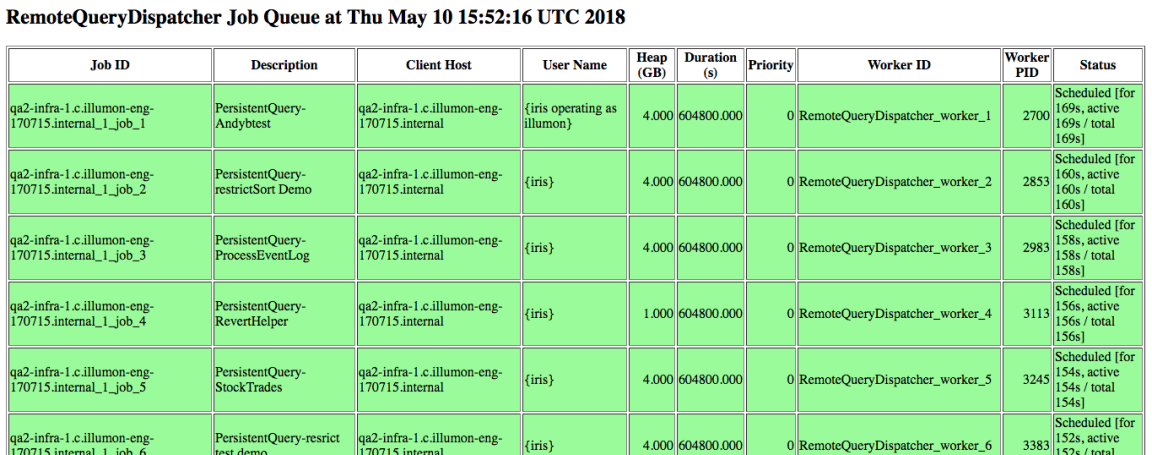
The following columns are displayed.
- Job ID - the internal dispatcher job ID
- Description - a brief description of the job
- A description that starts with "Console-" indicates it's a console
- A description that starts with "PersistentQuery-" indicates that it is a persistent query and is followed by the persistent query name
- Client Host - the host of the client that started the job
- User Name - the user that is running the query
- Heap (GB) - the job's heap usage in GB
- Duration(s) - the maximum duration of the query in seconds
- Priority - the job's priority (a lower number indicates a higher priority)
- Worker ID - the worker ID of this job
- Worker PID - the PID of this worker, if available
- Status - the job's current status
- Assigned - the job is assigned to a worker but is not yet running
- Cancelled - the job has been cancelled but has not yet stopped
- Finished - the job has completed
- Scheduled - the job is actively running
- Waiting - waiting to be started
Web Services Properties
For the Remote Query dispatcher, the following properties define how the web server runs:
|
Property Name |
Meaning |
Default Value |
|
RemoteQueryDispatcher.webserver.enabled |
If this is defined as |
false |
|
RemoteQueryDispatcher.webserver.port |
The port to be used for the Jetty server for the Remote Query Dispatcher. |
8084 |
|
RemoteQueryDispatcher.webserver.sslRequired |
If this is defined as true, an SSL certificate will be required and used for the Remote Query Dispatcher's Web services, and the connection will be over https. |
true |
|
RemoteQueryDispatcher.webserver.authenticationRequired |
If this is |
true |
The following parameters apply to the Remote Query Dispatcher web servers.
|
Property Name |
Meaning |
Default Value |
|
RemoteQueryDispatcher.tls.keystore |
If SSL is being used, the keystore to be searched to find the certificate for the encrypted https connection. |
<none> |
|
RemoteQueryDispatcher.tls.passphrase |
If SSL is being used, the passphrase to be used to verify the integrity of the keystore. This string is base64 encoded to prevent accidental exposure; or, alternately, and recommended, this passphrase can instead be stored in an external file. See |
<none> |
|
RemoteQueryDispatcher.tls.passphrase.file |
If SSL is being used, the passphrase to be used for the encrypted https connection. This string in the file is base64 encoded to prevent accidental exposure. The file name and path are not base64 encoded. This property can be and is recommended to be used instead of |
<none> |
The Data Import Server web server is configured through the data routing service YML configuration file. The following parameters apply to the Data Import Server web servers. Note that “db_dis” prefix is a default. This prefix must match the DIS name in the data routing service YML configuration file. See Data Routing Service Configuration via YAML for further details.
|
Property Name |
Meaning |
Default Value |
|
db_dis.tls.keystore |
If SSL is being used, the keystore to be searched to find the certificate for the encrypted https connection. |
<none> |
|
db_dis.tls.passphrase |
If SSL is being used, the passphrase to be used to verify the integrity of the keystore. This string is base64 encoded to prevent accidental exposure; or, alternately, and recommended, this passphrase can instead be stored in an external file. See |
<none> |
|
db_dis.tls.passphrase.file |
If SSL is being used, the passphrase to be used for the encrypted https connection. This string in the file is base64 encoded to prevent accidental exposure. The file name and path are not base64 encoded. This property can be and is recommended to be used instead of |
<none> |
Performing a Thread Dump
There are times during incident management when the Deephaven Support team may ask you to perform a Thread Dump of a particular Deephaven process. This does not impact the system in any way, but records valuable diagnostic information into the logs to be used in troubleshooting.
Performing a Thread Dump with jstack
To perform a Thread Dump, simply run:
sudo jstack -F <pid> > <file-path>
pid: is the Process Id of the Deephaven process, and file-path: is the file path where the thread dump will be written.
For example, to perform a Thread Dump of Worker 1, use ps, grep and awk to capture the process id.
sudo jstack -F $(ps -ef | grep worker_1 | awk '{print $2}' | head -n 1) > /tmp/threadDumpWorker1.txt
Performing a Thread Dump with kill -3 (SIGQUIT)
In cases where you want the thread dump to go to the process logs, 'kill -3' can be used. When 'kill -3' is used, the thread dump is sent to the standard output stream of the process.
To perform a Thread Dump with kill -3, simply run:
sudo kill -3 <pid>
Where pid: is the Process Id of the Deephaven process
For example, to perform a Thread Dump of Worker 1, use ps, grep and awk to capture the process id.
sudo kill -3 $(ps -ef | grep worker_1 | awk '{print $2}' | head -n 1)
By default, Worker logs are sent to the Deephaven database along with stderr and stdout, where stderr is redirected to the stdout for the process.
To view stdout logs for Worker 1, the following query can be used:
t=db.i("DbInternal", "ProcessEventLog").where("Date=`" + today + "`").where("Process=`worker_1`").where("Level=`STDOUT`")
Finding Errors
Persistent query processes record their activity and state in the ProcessEventLog and the PersistentQueryStateLog tables. When errors or exceptions occur, these tables can be queried to find error messages or queries that have failed.
Querying the PersistentQueryStateLog Table
The PersistentQueryStateLog is updated every time a persistent query changes state, and can be used to see both the current state of any persistent query as well as all the historical states. The status of failed queries could be:
- Failed: The persistent query failed before or during initialization.
- Error: An error occurred after the query was initialized (e.g., processing incremental updates)
- Disconnected: The worker process disconnected from the dispatcher. Often this results from a problem that terminates the JVM without giving the worker a chance to notify the dispatcher (e.g., OutOfMemoryError or hotspot errors in native code).
The following example shows all times a persistent query entered a failure state on the current date:
pqsAllFailedStates = db.i("DbInternal","PersistentQueryStateLog").where("Date=currentDateNy()", "Status in `Failed`, `Error`, `Disconnected`")
Adding a lastBy() call to the query shows the most recent state of any persistent query that attempted to start on the current date:
pqslAllCurrentStates = db.i("DbInternal","PersistentQueryStateLog").where("Date=currentDateNy()").lastBy("SerialNumber")
Combining the above queries indicates which persistent queries have entered a failure state on the current date:
pqslCurrentFailedStates = db.i("DbInternal","PersistentQueryStateLog").where("Date=currentDateNy()").lastBy("SerialNumber").where("Status in `Failed`, `Error`, `Disconnected`")
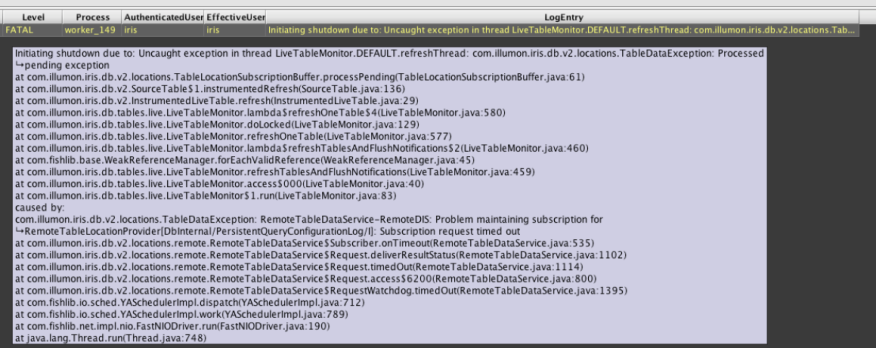
Querying the ProcessEventLog Table
To find all FATAL Level messages in the ProcessEventLog, the following query can be used:
t = db.i("DbInternal","ProcessEventLog").where("Date=currentDateNy()").where("Level==`FATAL`")
To find specific errors or error messages for a specific query worker, first query the PersistentQueryStateLog table to determine the worker name and worker host and use these values to query the ProcessEventLog. For example:
workerHost="hostname"
workerId="worker_123"
errorText="Problem maintaining subscription"
t = db.i("DbInternal","ProcessEventLog")
.where("Date=currentDateNy()")
.where("Host==workerHost")
.where("Process==workerId")
.where("LogEntry.contains(errorText)")
Hold your mouse over the Log Entry to view the full exception message and stack trace from the results of the query.
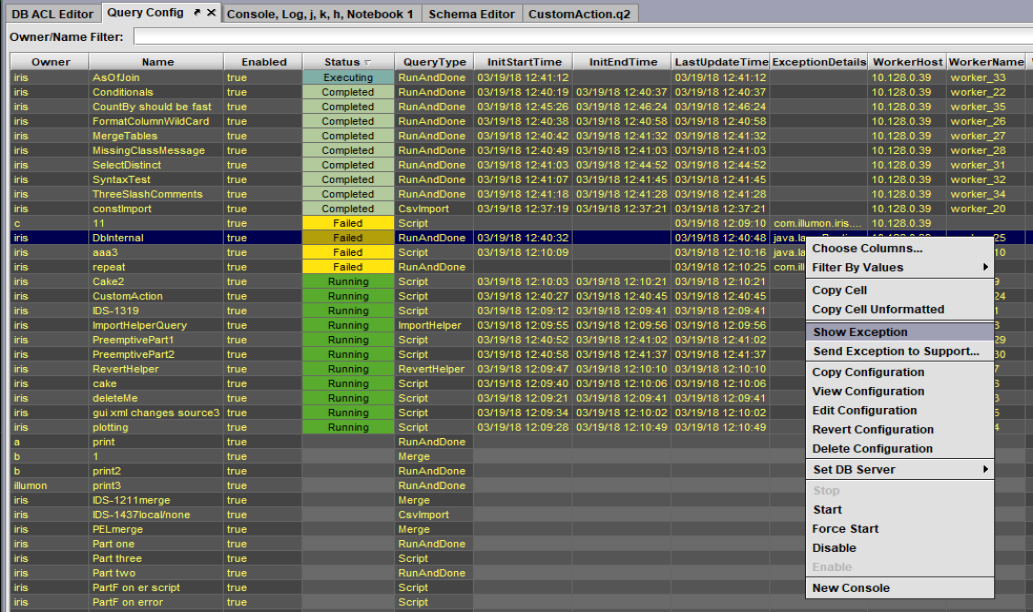
Viewing Persistent Query Exceptions in the Console
When a persistent query fails with a Java exception, you can view the exception message and stack trace in the Deephaven console.
To view the exception message, click the Query Config button to open the Query Config panel. Then right-click on the failed query in the "Exception Details" column and select Show Exceptions in the drop-down menu:
Deephaven Upgrades
Deephaven is designed to facilitate upgrades and rollbacks. It is important to ensure you complete a backup of the Deephaven database and all configuration files before performing an upgrade.
A first-time install of Deephaven requires two RPM packages:
- Database RPM
- Config RPM
Your Deephaven account representative will provide you with the latest versions of these two packages. Please refer to the Deephaven Server Installation Guide for additional details on a first-time installation.
Subsequent installation or upgrades require installing only the Database RPM. The release notes will instruct Administrators if any changes or edits to configuration files are required.
To upgrade Deephaven to the latest software release, you will first need to copy the new packages onto your Deephaven Linux hosts and run the following commands to update the Deephaven Database.
sudo yum localinstall illumon-db-<VERSION>.rpm -y
The installer will not delete or overwrite any existing files. It simply lays down the new files and updates a symbolic link called latest in the /usr/illumon folder.
If new schemas or internal database changes are part of a new release, administrators will also be required to run a dhconfig command (usually of the form dhconfig schemas import <options>)to create or update any table definitions. Please check the respective release notes for any additional information or instructions specific to the new release.
If there are any issues or problems with the new release, updating the latest symlink will revert the system binaries back to the previous release.
If any changes were made to the database or config files, these will need to be restored if a rollback is required.
Deephaven Hotfixes
A hotfix update is a single minor release to address a problem in a Deephaven release. Typically, hotfixes are made to address a specific customer situation.
If a hotfix is applicable to your current Deephaven deployment, your Deephaven account representative will provide you with the hotfix installation package.
Copy the new packages onto your Deephaven Linux hosts and run the following commands to apply the hotfix:
sudo yum localinstall illumon-db-<VERSION>.rpm -y
The installation procedure for a hotfix is similar to regular Deephaven upgrades. The installer will not delete or overwrite any existing files. It simply lays down the new files and updates a symbolic link called latest in the /usr/illumon folder.
The directory in the Release Notes section of the Deephaven Documentation includes the full version log for active Deephaven versions.
Custom Libraries, Overrides and Hotfixes
Any custom or third party libraries and resources, such as JARs, class files, property files, etc. can be added to designated directories to override and/or extend your Deephaven installation.
The following directories are placed in the front of the CLASSPATH of Deephaven processes. Add any custom or third party resources to the following directories:
/etc/sysconfig/illumon.d/java_lib- For any user and/or third-party Java libraries (JARs). Any JARs placed in this directory will be found on the classpath of Deephaven processes./etc/sysconfig/illumon.d/override- For class files, properties or other Java resources that should override those contained in thejava_libJARs./etc/sysconfig/illumon.d/hotfixes- This path contains any JAR files that should be used instead of those contained in thejava_libdirectories.
Restart Affected Processes
After a Deephaven hotfix package has been applied or any custom libraries, overrides or custom hotfixes have been placed in designated directories, the affected Deephaven processes need to be restarted.
In most cases, a restart of all Deephaven processes on the server will be required. This is accomplished using the following command:
sudo monit restart all
In cases where the hotfix or custom extensions are applicable to a specific Deephaven process, only that process needs to be restarted. Please refer to the Startup/Shutdown of Deephaven Processes section for instructions on restarting individual Deephaven processes.
Troubleshooting Custom Hotfixes and Extensions
In some cases, third party libraries, custom extensions or hotfixes can cause conflicts or errors with existing Deephaven code libraries. Refer to the Log files for any errors or warnings once processes have been restarted with custom extensions.
Debugging Process Configuration
Use the sudo jinfo <pid> command to print Java configuration information for a specified Java process like the CLASSPATH and other useful info about a running Java process.
Debugging SSL/TLS Connections
Understanding SSL/TLS connection problems can sometimes be difficult, especially when it is not clear what messages are actually being sent and received.
You can get excellent certificate debugging by adding -Djavax.net.debug=all to your Java launch parameters to help troubleshoot or diagnose SSL/TLS Connections.
Last Updated: 16 February 2021 18:07 -04:00 UTC Deephaven v.1.20200928 (See other versions)
Deephaven Documentation Copyright 2016-2020 Deephaven Data Labs, LLC All Rights Reserved