Show Totals
Overview
For users who want to see aggregated column values in a table, such as the total sum of values in a column, or an average value of a particular column, Deephaven offers two options. Data aggregation can be accomplished through the Deephaven console using the Show Totals option in the right-click context menu, or it can be accomplished through the query language in a persistent query.
The following section details how to use Show Totals in a Deephaven console. See: Configuring Table Totals through a Query for more about using query methods.
Show Totals
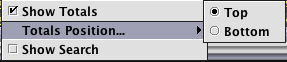
To display aggregated column values in a Deephaven table, the Show Totals option must be enabled. To do this, right-click in the column header row of the table in Deephaven and select the Show Totals check box, which is deselected by default. When Show Totals is selected, a Grand Totals section appears at the top of the table.
If you right-click in a column header again, the Totals Position option will appear, as shown in the image below. This option enables you to place the totals content at the top of the table or at the bottom. It defaults to the Top position.
Grand Totals
Initially, the information in the Grand Totals section is collapsed, as indicated by the downward pointing chevron icon  at the right of the section. To review the information in the Grand Totals section, click anywhere within the header. This will enable the Grand Totals section to display totals of any of the columns in the table containing numerical data. To collapse the Grand Totals section again, click the upward pointing chevron icon
  , or anywhere within the header.
For example, the following screenshot demonstrates the result when the Grand Totals feature is activated using the StockQuotes table in the LearnDeephaven namespace:

All of the values are added together in each respective column. Here, the section includes the sums for the Bid, BidSize, Ask and AskSize columns. However, no results are displayed for the BidCustSize and AskCustSize columns because they contain null values in the table. The other columns in the table cannot be aggregated because they do not contain numerical values.
Edit Totals
Right-clicking anywhere within the expanded Grand Totals section reveals the Edit Totals option, as shown below:
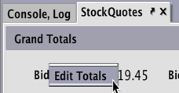
When selected, the Edit Totals dialog window will open and provide a selection of options that can be used to aggregate columns in different and multiple ways. The left side of the Edit Totals dialog window shows the available columns in the table, while the right side is used to apply different aggregation methods on specified columns. See the example screenshot below.
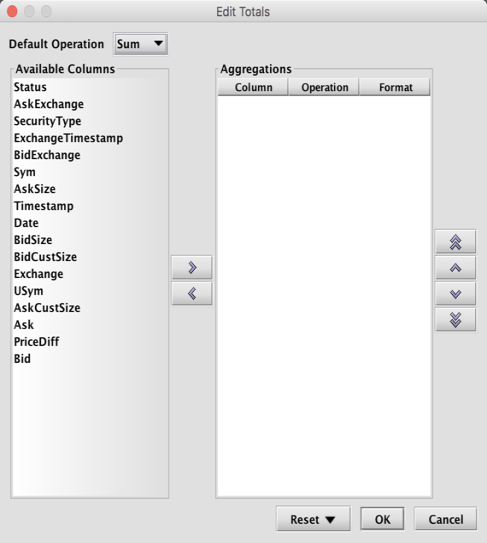
The Default Operation for all the columns is Sum. To select a column for a specific aggregation method, first select the column name from the Available Columns list on the left and then click the button with the right-facing arrow in the center of the panel. That column name will then be moved to the Aggregations side of the window.
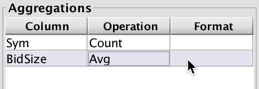
When you have moved a column from the Available Columns list to the Aggregations field, you can assign a particular aggregation operation to perform on that column. This is accomplished using the drop-down menu that opens when you click the value listed for that column name under Operation.
When selected, the Operation column will only display aggregations that are meaningful for the data type found in that column. For example, if you select numeric columns such as Ask or Bid, operations will include any aggregations that are meaningful for numerical data, including calculations for sum, average, standard deviation, and more. However, if you select text-based columns such as Sym or USym, you can only choose to count the rows, show the First/Last item in the column, or show the Min (alphabetically first)/Max (alphabetically last) item in the column.
To remove a specific column from the aggregation list, first select the column name from the right side of the window and then click the button with left-facing arrow  .
.
Users may also specify a formatting type by which to display each aggregation by clicking the cell in the Format column for that row.
For example, selecting the cell in the BidSize row in the Aggregations section opens the Enter Formatting Formula dialog.
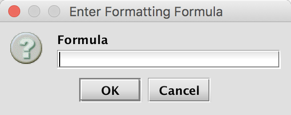
Specifying a format is optional. If the Format field is not set, the total for that aggregation will appear using the default format. Date and Decimal are the only formula types supported, and these share the same arguments as the formatColumns method.
See Formatting Tables for more information on the available arguments.
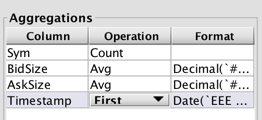
In this example, the average BidSize and AskSize in the Grand Totals section are set to display with two decimal places using the formula Decimal(`###.00`), and the Timestamp is set to show the day of week, month and time using the formula Date(`EEE dd MMM yy HH:MM:ss`).
Columns that are not individually aggregated as described above are also included in the Grand Totals section of the table. However, the same method of aggregation is used for each of those columns. The method used to aggregate those columns is determined based on the value selected in the Default Operations drop-down menu in the Edit Totals dialog, as shown below. Options include Count, Min, Max, Sum, Var, Avg, Std, First, Last and Skip.
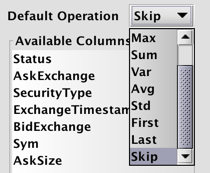
If not set, this will be Sum. In this example, the Default Operation is set to Skip. Only the columns included in the Aggregations field will appear in Grand Totals.
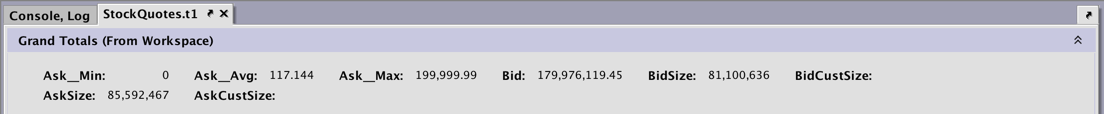
The resulting Grand Totals section is shown below:

Note: "From Workspace" in the header indicates that the Grand Totals were edited in the user interface, rather than the query language.
Deephaven also enables users to present multiple aggregation methods on the same columns. For example, you want to see the aggregated values representing the minimum Ask value, the average Ask value and the maximum Ask value. This is accomplished by selecting the same column multiple times using the button with the right-facing arrow button, and then applying different aggregation operations for each reference to the same column. The screenshot below demonstrates how to apply three different aggregation methods to the same column.
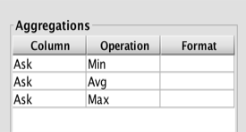
The display will then specify which operation is applied to that total:
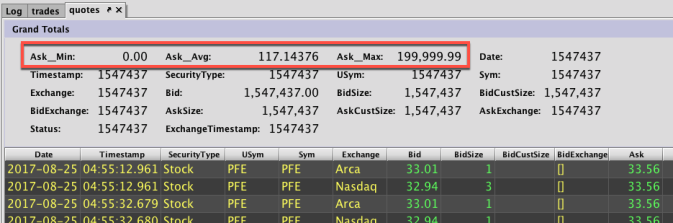
The three individually aggregated columns previously specified in the Edit Totals dialog window appear first in order, as noted in the red box. Then, each of the other columns in the table, which have been aggregated using Count, are presented (see above).
If a method is selected in the Default Operation menu that does not apply to a column that was not specified in the Aggregation section of the Edit Totals dialog, the column will not appear in the Grand Total header. For example, In the previous screenshot, Count was chosen as the Default Operation. Therefore, all columns were presented because the value types in all columns can be counted. Contrast that with the following screenshot of the Grand Totals section when Sum is chosen as the Default Operation.
Only eight columns are visible now, because the data types in the other columns cannot be aggregated with Sum.
Changing Column Order
The column names and values shown in the Grand Totals section of the table can be reordered as desired. To do so, select the column you want to reorder from the right side of the Edit Totals dialog window. Then select from the buttons available on the right side of the dialog window, as shown below:
|
|
Moves the selected column to the top of the order. |
|
|
Moves the selected column up one position. |
|
|
Moves the selected column down one position. |
|
|
Moves the selected column to the bottom of the order. |


However, the change in order only applies to columns selected through the Edit Totals dialog. All other rows selected will be presented in the order they appear in the table.
Totals
The Grand Totals section displays the various column totals for all the data within the table. If you filter the table using the filtering options available in the right-click context menu, a new Totals section is added above the Grand Totals section in the table.
The Totals section presents the same column(s) and their respective aggregation operations as the Grand Totals section. However, the values shown in the Totals section apply only to the values included in the filtered dataset. Any time you add, remove or modify a filter in the table, the data in Totals section of the table will automatically update.
Similar to the operations applied for Grand Totals, right-clicking within the body of the Totals bar opens the Edit Totals dialog, which may be customized in the same manner as described earlier. Both sections share the same configuration parameters. Therefore, any configuration changes in the Edit Totals dialog will apply to both the Totals and the Grand Totals sections.
In the example below, the StockQuotes table has been filtered to show rows when the value in the Sym column is GOOG.
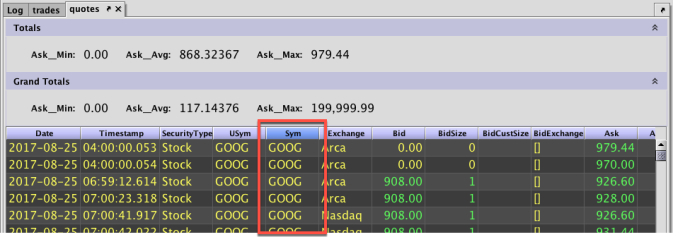
The Grand Totals section and the Totals section both show the same set of three aggregations on the Ask column: Min, Avg and Max. However, because the table was filtered on the Sym column to show only data for GOOG, the Totals section of the table shows those same three aggregations only as they apply to data related to GOOG, whereas the Grand Totals section continues to present three aggregations on the entire table.
Reset
The Reset button at the bottom of the Edit Totals dialog allows you to restore both the Grand Totals and the Totals sections to a previous setting. It contains two options: Table Default and User Default.
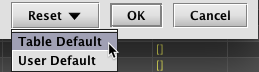
The Table Default option restores the Grand Totals and the Totals sections to the parameters defined when the table was created, or back to Sum if no operations were specified. The User Default option restores the panel to the settings used when the Edit Totals dialog was most recently manually reconfigured. If the user saves the workspace and subsequently reopens the table in another Deephaven session, the user can restore their preferred settings.
Last Updated: 16 February 2021 18:07 -04:00 UTC Deephaven v.1.20200928 (See other versions)
Deephaven Documentation Copyright 2016-2020 Deephaven Data Labs, LLC All Rights Reserved