Aggregation
Aggregation is used to express data/information in a summary form. An aggregation operation groups the values of multiple rows based on the distinct criteria selected, performs a calculation on the values in those groups, and then returns a summary of the values in each group.
Three different types of aggregations are available:
Dedicated Aggregators
Deephaven provides several predefined aggregation functions:
|
Function |
Description |
|---|---|
|
Find each distinct value or set of values for the column(s) listed in the Group the rows containing the same distinct value. Return the first row for each group. (See example table |
|
|
Find each distinct value or set of values for the column(s) listed in the Group the rows containing the same distinct value. Return the last row for each group. |
|
|
Find each distinct value or set of values for the column(s) listed in the Group the rows containing the same distinct value. For each group, calculate the sum of the data in each of the other columns. (See example table |
|
|
Find each distinct value or set of values for the column(s) listed in the Group the rows containing the same distinct value. For each group, calculate the average (mean) of the data in each of the other columns. (See example table t5 below) |
|
|
Find each distinct value or set of values for the column(s) listed in the Group the rows containing the same distinct value. For each group, calculate the standard deviation of the data in each of the other columns. |
|
|
Find each distinct value or set of values for the column(s) listed in the Group the rows containing the same distinct value. For each group, calculate the variance of the data in each of the other columns. |
|
|
Find each distinct value or set of values for the column(s) listed in the Group the rows containing the same distinct value. For each group, calculate the median of the data in each of the other columns. |
|
|
Find each distinct value or set of values for the column(s) listed in the Group the rows containing the same distinct value. For each group, calculate the minimum of the data in each of the other columns. (See example |
|
|
Find each distinct value or set of values for the column(s) listed in the Group the rows containing the same distinct value. For each group, calculate the maximum of the data in each of the other columns. |
|
|
Find each distinct value or set of values for the column(s) listed in the Group the rows containing the same distinct value. Count the number of rows in each group. (See example |
|
|
Calculates the number of values in the column indicated in the Equivalent to (See example |
|
|
|
Find each distinct value or set of values for the column(s) listed in the Group the rows containing the same distinct value. Return the first (See example table |
|
|
Find each distinct value or set of values for the column(s) listed in the Group the rows containing the same distinct value. Return the last (See example table |
Note:
- It is the user's responsibility to ensure the aggregation formula is compatible with the data type of each column being aggregated. For example, if you perform an
.avgByon a column containing strings, the query will throw an error. -
If multiple aggregations are applied to one column without renaming the output columns, the query will throw an error; e.g, "
.update("X = 42").by(AggCombo(AggSum("X"),AggAvg("X")))." - If there is no value in the
groupByColumnsargument, for methods other thancountBy, grouping is not performed.countBywith no arguments will fail. - If multiple values are used in the
groupByColumnsargument, each distinct value set is used for grouping.
|
|
|
|
|
Example Set 2
apples
|
Name |
Color |
Price |
Quantity |
|---|---|---|---|
|
Gala |
red |
1.25 |
500 |
|
Fuji |
red |
1.35 |
380 |
|
Granny Smith |
green |
1.85 |
500 |
|
Honey Crisp |
red |
3.25 |
80 |
|
Golden |
green |
1.25 |
370 |
t4=apples.view("Color","Quantity").sumBy("Color")
|
Color |
Quantity |
|---|---|
|
red |
960 |
|
green |
870 |
t5=apples.view("Color","Price").avgBy("Color")
|
Color |
Price |
|---|---|
|
red |
1.95 |
|
green |
1.55 |
|
Price |
Name |
Color |
Quantity |
|---|---|---|---|
|
1.25 |
Gala |
green |
370 |
|
1.35 |
Fuji |
red |
380 |
|
1.85 |
GrannySmith |
green |
500 |
|
3.25 |
HoneyCrisp |
red |
80 |
t7=apples.countBy("Count", "Color")
|
Color |
Count |
|---|---|
|
red |
3 |
|
green |
2 |
|
Name |
|---|
|
5 |
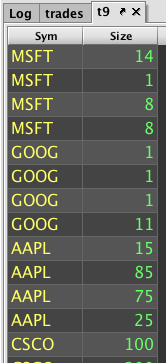
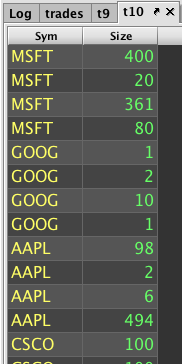
The table below shows example queries where the table is aggregated by Sym and then simplified to show only two columns. Finally, the first four rows for each Sym is shown under headBy(). The last four rows for each Sym is shown under tailBy().
|
headBy() |
tailBy() |
|---|---|
|
|
|
|
|
Combined Aggregations
Deephaven also allows you to perform multiple aggregations at once using the following functions:
|
Function |
Description |
|---|---|
|
ComboBy AggArray |
Creates an array of all the values in the source column(s) and then aggregates the results into their own column(s). |
|
ComboBy AggAvg |
Computes an average value in the source column(s) and then aggregates the results into their own column(s). |
|
ComboBy AggWAvg |
Computes a weighted average in the source column(s) and then aggregates the results into their own column(s). |
|
ComboBy AggCount |
Counts the number of rows in the source column(s) and then aggregates the results into their own column(s). |
|
ComboBy AggCountDistinct |
Creates a distinct count aggregation. The output column contains the number of distinct values for the input column in that group. |
|
ComboBy AggDistinct |
Creates a distinct aggregation. The output column contains a |
|
ComboBy AggFirst |
Groups rows containing the same distinct value in the source column(s), returns the first row, and then aggregates the results into their own column(s). |
|
ComboBy AggLast |
Groups rows containing the same distinct value in the source column(s), returns the last row, and then aggregates the results into their own column(s). |
|
ComboBy AggMax |
Computes a maximum value in the source column(s) and then aggregates the results into their own column(s). |
|
ComboBy AggMed |
Computes a median value in the source column(s) and then aggregates the results into their own column(s). |
|
ComboBy AggMin |
Computes a minimum value in the source column(s) and then aggregates the results into their own column(s). |
|
ComboBy AggPct |
Computes the designated percentile of values in the source column(s) and then aggregates the results into their own column(s). |
|
ComboBy AggStd |
Computes standard deviations of values in the source column(s) and then aggregates the results into their own column(s). |
|
ComboBy AggSum |
Computes a total sum of values in the source column(s) and aggregates then the results into their own column(s). |
|
ComboBy AggWSum |
Computes a weighted sum in the source column(s) and then aggregates the results into their own column(s). |
|
ComboBy AggVar |
Computes the variance of the data of values in the source column(s) and then aggregates the results into their own column(s). |
Syntax
resultTable = sourceTable.by(AggCombo(ComboBy... Aggregators), String... groupByColumns);
Each aggregation must be defined by a ComboBy method signature. These are created using methods in the ComboAggregateFactory class. There is one method for each type of aggregation.
ComboBy AggMin(String...)ComboBy AggMax(String...)ComboBy AggSum(String...)ComboBy AggVar(String...)ComboBy AggAvg(String...)ComboBy AggWAvg(weight, String...)ComboBy AggWSum (weight, String...)ComboBy AggStd(String...)ComboBy AggFirst(String...)ComboBy AggLast(String...)ComboBy AggMed(String...)ComboBy AggPct(percentile, String...)ComboBy AggArray(String...)ComboBy AggCount(String resultColumn)
The arguments for these methods include the name of the source column(s) for the calculations and the name(s) for the columns to be used in the new table.
See also: Class ComboAggregateFactory
Example
For this example, assume there is a table containing data regarding the trade of securities for a single day. The goal is to calculate the earliest timestamp and lowest price in the table. The appropriate ComboBy method follows:
AggMin("Timestamp", "Price")
Because the resulting values are aggregated, it is important to rename the resulting columns with the aggregated title. This is demonstrated in the following:
AggMin("EarliestTimestamp=Timestamp", "EarliestPrice=Price")
The syntax shown above applies to all of the ComboBy methods except AggCount(). The count is based on the number of rows rather than any particular source column, so the only argument to AggCount() is the desired result column name. For example, one could use AggCount("Count") or AggCount("Total").
Passing multiple ComboBys provides a concise and expressive syntax for aggregation. The example below demonstrates the complete syntax in which the AggMin() and AggCount() calls from above would be used to compute the earliest timestamp, lowest price, and total number of rows by USym and Exchange from the "StockTrades" table:
from deephaven import *  # ComboAggregateFactory module imported as caf

resultTable = db.t("LearnDeephaven", "StockTrades").by(caf.AggCombo(
    caf.AggMax("Timestamp"),
    caf.AggMin("EarliestTimestamp=Timestamp", "LowestPrice=Last"),
    caf.AggCount("Count")
    ), "Exchange", "Sym")
resultTable = db.t("LearnDeephaven", "StockTrades").by(AggCombo(
    AggMax("Timestamp"),
    AggMin("EarliestTimestamp=Timestamp", "LowestPrice=Last"),
    AggCount("Count")
), "Exchange", "Sym")
Combined Aggregations Example
Imagine working with the following clip of trades1 table, which contains records of option trades in companies ABC and XYZ:
trades1
|
Timestamp |
USym |
Sym |
Size |
Price |
|---|---|---|---|---|
|
12:01:34 |
ABC |
ABC_2016_02_19_100.00_P |
10 |
0.30 |
|
12:01:48 |
ABC |
ABC_2016_02_19_90.00_P |
32 |
0.05 |
|
12:01:54 |
XYZ |
XYZ_2016_07_15_45.00_C |
12 |
0.15 |
|
12:02:14 |
ABC |
ABC_2016_02_19_110.00_C |
15 |
0.04 |
|
12:02:37 |
XYZ |
XYZ_2016_07_15_47.00_C |
20 |
0.01 |
For each underlying USym, you want to calculate the first and last trade times, the total size traded, and the average trade size. This requires calculating minima, maxima, sums, and averages — four different types of aggregations. You could do all those calculations using minBy(), maxBy(), sumBy(), and avgBy() in four separate steps, creating four separate tables. Then, you'd need to join the results. The following example query shows that lengthy and expensive procedure:
trades1 = db.t("LearnDeephaven", "StockTrades").where("Date = `2017-08-25`")
firstTrades = trades1.view("USym", "Timestamp").minBy("USym")
lastTrades = trades1.view("USym", "Timestamp").maxBy("USym")
totalSize = trades1.view("USym", "Size").sumBy("USym")
avgSize = trades1.view("USym", "Size").avgBy("USym")
tradeStats = firstTrades.view("USym", "FirstTrade=Timestamp")\
    .naturalJoin(lastTrades, "USym", "LastTrade=Timestamp")\
    .naturalJoin(totalSize, "USym", "Size")\
    .naturalJoin(avgSize, "USym", "AvgSize=Size")
Compare that to the following, which is produced more efficiently, and with simpler, more compact code, using the combined aggregation syntax:
from deephaven import *  # ComboAggregateFactory module imported as caf

tradeStats = trades1.by(caf.AggCombo(
    caf.AggMin("FirstTrade=Timestamp"),
    caf.AggMax("LastTrade=Timestamp"),
    caf.AggSum("Size"),
    caf.AggAvg("AvgSize=Size")),
    "USym")
tradeStats = trades1.by(AggCombo(
    AggMin("FirstTrade=Timestamp"),
    AggMax("LastTrade=Timestamp"),
    AggSum("Size"),
    AggAvg("AvgSize=Size")),
    "USym")
Either way, the resulting tradeStats table contains the same data:
tradeStats
|
USym |
FirstTrade |
LastTrade |
Size |
AvgSize |
|---|---|---|---|---|
|
ABC |
12:01:34 |
12:02:14 |
57 |
19 |
|
XYZ |
12:01:54 |
12:02:37 |
32 |
16 |
User-defined Aggregators
You can define your own aggregations using the following syntax:
Table applyToAllBy(String formulaColumn,String... groupByColumns)
groupByColumns groups data by columns and applies formulaColumn to each of the columns not altered by the grouping operation.
formulaColumn represents the formula applied to each column, and uses the parameter "each" to refer to each column to which it is being applied. "Each" is an array of the values grouped by the groupByColumns.
Note: It is user's responsibility to ensure the aggregation formula is compatible with the data type for each column being aggregated.
Example
table
|
A |
B |
C |
|---|---|---|
|
1 |
10 |
AAPL |
|
2 |
20 |
IBM |
|
3 |
30 |
C |
|
4 |
40 |
AAPL |
|
5 |
50 |
AA |
applyToAllBy("`The second element is` + each[1]" ,"Parity=A%2")
|
Parity |
A |
B |
C |
|---|---|---|---|
|
1 |
The second element is 3 |
The second element is 30 |
The second element is C |
|
0 |
The second element is 4 |
The second element is 40 |
The second element is AAPL |
Example 2
The example query below opens a table and selects values
In the t2 query, the applyToAllBy method is used to aggregate the Price and Size columns based on Sym and then apply a common formula to manipulate the values in the Last and Size column.
The t3 query shows the same process using the by and updateView methods instead of applyToAllBy. However, the Last and Size columns are manipulated individually with their own formula.
In this case, the t2 and t3 tables will be identical.
t = db.t("LearnDeephaven", "StockTrades").where("Date=`2017-08-21`")
t2 = t.select("Sym", "Last", "Size").applyToAllBy("each+1", "Sym")
t3 = t.select("Sym", "Last", "Size").by("Sym").updateView("Last=Last+1", "Size=Size+1")
Last Updated: 16 February 2021 18:07 -04:00 UTC Deephaven v.1.20200928 (See other versions)
Deephaven Documentation Copyright 2016-2020 Deephaven Data Labs, LLC All Rights Reserved