Pie Plots
The pie plot shows data as sections of a circle to represent the relative proportion for each of the categories that make up the entire dataset being plotted.
Data Sourcing
Pies plots can be created using data from tables or arrays.
Creating a Pie Plot using Data from a Table
When data is sourced from a table, the following syntax can be used to create a pie plot:
piePlot("SeriesName", source, "CategoryCol", "ValueCol")
piePlotis the method used to create a pie plot."SeriesName"is the name (as a string) you want to use to identify the series on the plot itself.sourceis the table that holds the data you want to plot"CategoryCol"is the name of the column (as a string) to be used for the categories"ValueCol"is the name of the column (as a string) to be used for the values
Example
from deephaven import Plot

tPie = db.t("LearnDeephaven", "StockTrades")\
     .where("Date=`2017-08-25`")\
     .view("Sym", "Last", "Size", "ExchangeTimestamp")

totalShares = tPie.view("Sym", "SharesTraded=Size").sumBy("Sym")

pieChart = Plot.piePlot("Shares Traded", totalShares, "Sym", "SharesTraded")\
     .chartTitle("Total Shares")\
     .show()
tPie = db.t("LearnDeephaven", "StockTrades")
     .where("Date=`2017-08-25`")
     .view("Sym", "Last", "Size", "ExchangeTimestamp")

totalShares = tPie.view("Sym", "SharesTraded=Size").sumBy("Sym")

pieChart = piePlot("Shares Traded", totalShares, "Sym", "SharesTraded")
     .chartTitle("Total Shares")
     .show()
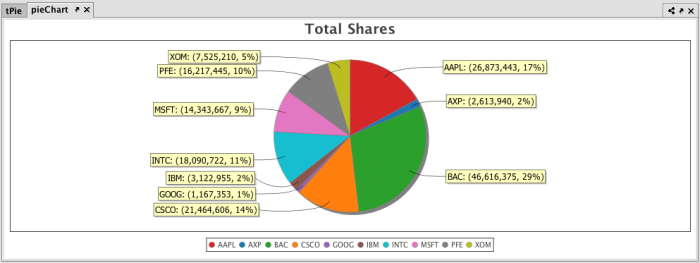
When the code above is processed, the following pie plot is produced, which shows the number of shares traded on August 25, 2017 for each symbol in the table.
Creating a Pie Plot using Data from an Array
When data is sourced from an array, the following syntax can be used:
piePlot("SeriesName", [category], [values]")
piePlotis the method used to create a pie chart."SeriesName"is the name (as a string) you want to use to identify the series on the chart.[category]is the array containing the data to be used for the X values[values]is the array containing the data to be used for the Y values
For additional formatting options for pie plots, please refer to:
Last Updated: 16 February 2021 18:07 -04:00 UTC Deephaven v.1.20200928 (See other versions)
Deephaven Documentation Copyright 2016-2020 Deephaven Data Labs, LLC All Rights Reserved