Formatting Plot Titles and Labels
Titles and labels are not automatically generated when plots are created in Deephaven. However, they can easily be added. Plot titles can also be created dynamically, based on content in the data.
Static Titles and Labels
|
Sample Syntax |
Action |
|---|---|
|
|
Add a figure title |
|
|
Add a chart title |
|
|
Add X axis label |
|
|
Add Y axis label |
Example
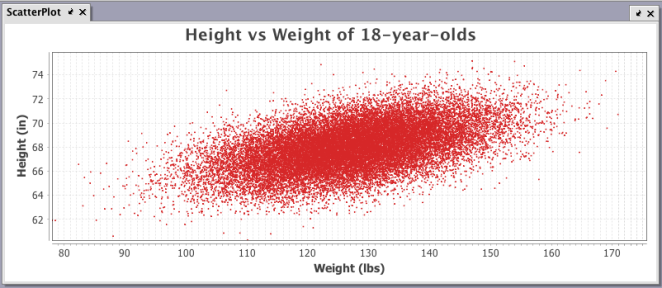
The chartTitle, xLabel and yLabel methods are demonstrated in the example query below.
                            from deephaven import Plot

ScatterPlot = Plot.figure() \
    .plot("Height/Weight", hwTable, "W", "H") \
    .linesVisible(False) \
    .pointsVisible(True) \
    .pointSize(0.1) \
    .chartTitle("Height vs Weight of 18-year-olds") \
    .xLabel("Weight (lbs)") \
    .yLabel("Height (in)") \
    .legendVisible(False) \
    .show()
                            ScatterPlot=figure()
    .plot("Height/Weight", hwTable,"W","H")
    .linesVisible(false)
    .pointsVisible(true)
    .pointSize(0.1)
    .chartTitle("Height vs Weight of 18-year-olds") //adds a chart title
    .xLabel("Weight (lbs)") //adds label to X axis
    .yLabel("Height (in)")  //adds label to y axis
    .legendVisible(false)
    .show()
When the code shown above is processed, the following chart is generated:
Dynamic Chart Titles
As described above, the chartTitle() method can be used to manually add titles to the plots you create in Deephaven. However, chart titles can also be dynamically generated based on the content of the data you are plotting.
Dynamic Chart Titles Using Table Data
To create a dynamic chart title using a value from the data you are plotting, the following syntax may be used:
.chartTitle(tableName, "ColumnValue")
For example, the following code sample will dynamically create a chart title using data from the Ticker column from the sampleTable2 table:
.chartTitle(sampleTable2, "Ticker")
The full query follows:
                            from deephaven import Plot

sampleTable2 = db.t("LearnDeephaven", "EODTrades")
    .where("ImportDate=`2017-11-01`")
    .where("Ticker=`CSC`")

samplePlot2 = Plot.plot("Price Trend", sampleTable2, "EODTimestamp", "Close")
    .chartTitle(sampleTable2, "Ticker")
    .show()
                            sampleTable2 = db.t("LearnDeephaven", "EODTrades").where("ImportDate=`2017-11-01`")
    .where("Ticker=`CSC`")

samplePlot2 = plot("Price Trend", sampleTable2, "EODTimestamp", "Close")
    .chartTitle(sampleTable2, "Ticker")
    .show()
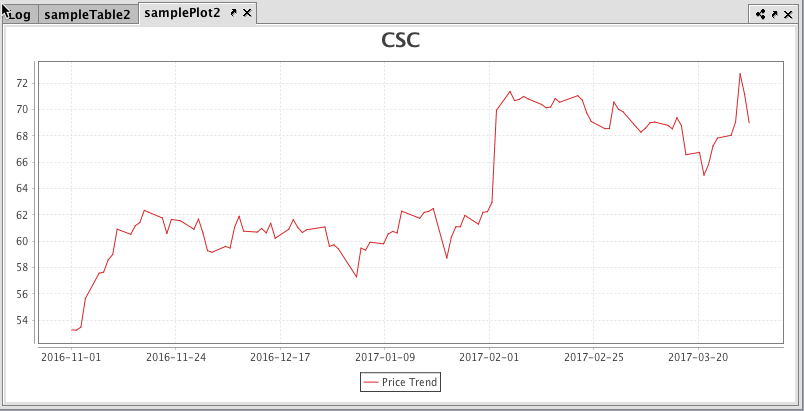
As shown above, the source table was filtered to show only CSC as the Ticker, so the chart title was dynamically created to match that value (CSC). If the source table was subsequently filtered to show only MSFT as the Ticker value, the chart title would update to show MSFT.
Dynamic Chart Titles Using OneClick
Dynamic chart titles can also be created using data from a table that is being filtered with a oneClick filter. In this case, the dynamic chart title updates when the underlying source updates (after the OneClick filter updates).
An example of using dynamic chart titles on a plot generated with a oneClick filter follows:
                            from deephaven import Plot

sampleTable = db.t("LearnDeephaven", "EODTrades")
    .where("ImportDate=`2017-11-01`")

oneClickTable1 = Plot.oneClick(sampleTable, "Ticker")

samplePlot = Plot.plot("Price Trend", oneClickTable1, "EODTimestamp", "Close")
    .chartTitle(oneClickTable1, "Ticker")
    .show()
                            sampleTable = db.t("LearnDeephaven", "EODTrades")
    .where("ImportDate=`2017-11-01`")

oneClickTable1 = oneClick(sampleTable, "Ticker")

samplePlot = plot("Price Trend", oneClickTable1, "EODTimestamp", "Close")
    .chartTitle(oneClickTable1, "Ticker")
    .show()
As shown in the above example, the oneClick filter is applied on the Ticker column and the same column is used in the chart title. For example, the oneClick filter in the screenshot below is set to AAPL, and the chart title matches the filtered value.
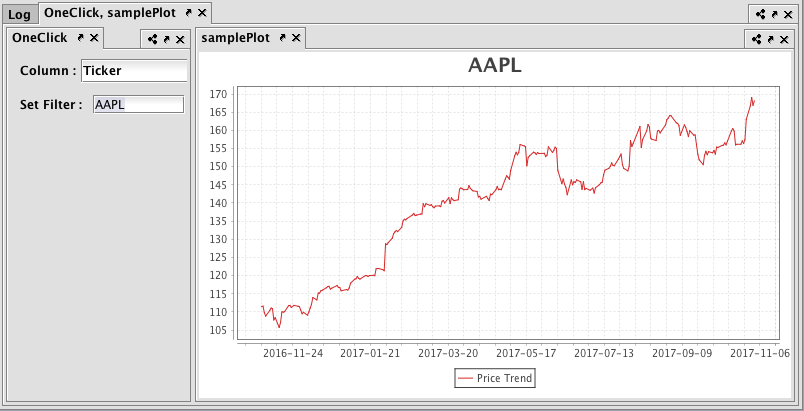
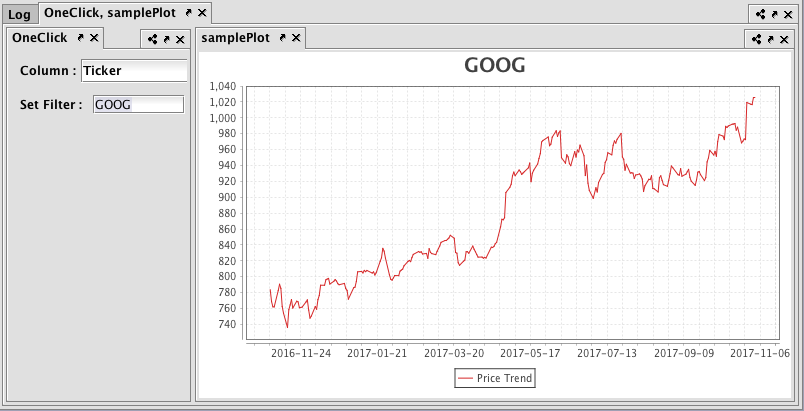
Whenever any valid filter value gets updated, the chart title will also get updated. So, when the oneClick filter is changed to GOOG, the chart title for the plot below also changes to GOOG. See below.
Configuration Options for Dynamic Chart Titles
The values shown for each column and the formatting used for the title string are configurable when using dynamically created chart titles.
Values Shown for Each Column
The number of values/rows shown for each column in the chart title can be configured in the following ways:
Plot.chartTitle.maxRowsInTitleproperty (default value is 0)maxRowsInTitle(int)method
The Plot.chartTitle.maxRowsInTitle is set to 0 in iris-defaults.prop and is applicable to all charts. It can be changed for a specific chart using maxRowsInTitle(int)method as shown in the following examples.
Note the following when setting the maxRowsInTitle property:
1. If maxRowsInTitle = 0 (the default value), only the first value from the title column will be shown, as in the above examples.
2. If maxRowsInTitle > 0: If the number of values/rows in a column is more than maxRowsInTitle, then the maxRowsInTitle rows will be shown as comma-separated values followed by an ellipsis (…). Otherwise, only comma-separated values will be shown without an ellipsis.
Example
from deephaven import Plot t = db.t("LearnDeephaven", "StockTrades")\ .where("Date=`2017-08-25`", "Sym=`AAPL`") p = Plot.plot("P", t, "Timestamp", "Last")\ .chartTitle(t.selectDistinct("Exchange"), "Exchange")\ .maxRowsInTitle(4)\ .show()t = db.t("LearnDeephaven", "StockTrades") .where("Date=`2017-08-25`", "Sym=`AAPL`") p = plot("P", t, "Timestamp", "Last") .chartTitle(t.selectDistinct("Exchange"), "Exchange") .maxRowsInTitle(4) .show()
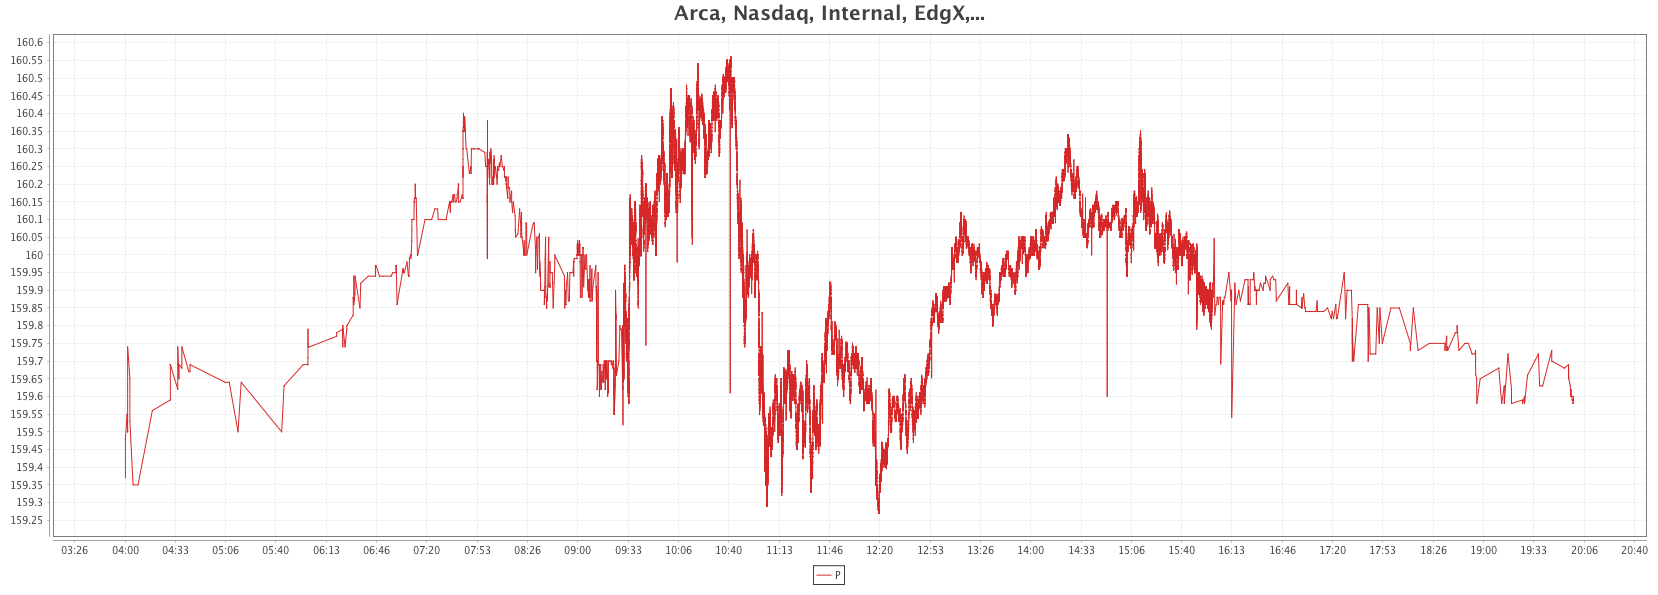
As shown above, the first four values are shown in the title. Since the column for the title (
Exchange) has 10 values (more than four), the title string has an ellipsis.
3. If maxRowsInTitle < 0: All values/rows in the column will be shown in the title and separated by commas.
Example
                            from deephaven import Plot
t = db.t("LearnDeephaven", "StockTrades")\
    .where("Date=`2017-08-25`", "Sym=`AAPL`")

p = Plot.plot("P", t, "Timestamp", "Last")\
    .chartTitle(t.selectDistinct("Exchange"), "Exchange")\
    .maxRowsInTitle(-1)\
    .show()
                            t = db.t("LearnDeephaven", "StockTrades")
     .where("Date=`2017-08-25`", "Sym=`AAPL`")

p = plot("P", t, "Timestamp", "Last")
     .chartTitle(t.selectDistinct("Exchange"), "Exchange")
     .maxRowsInTitle(-1)
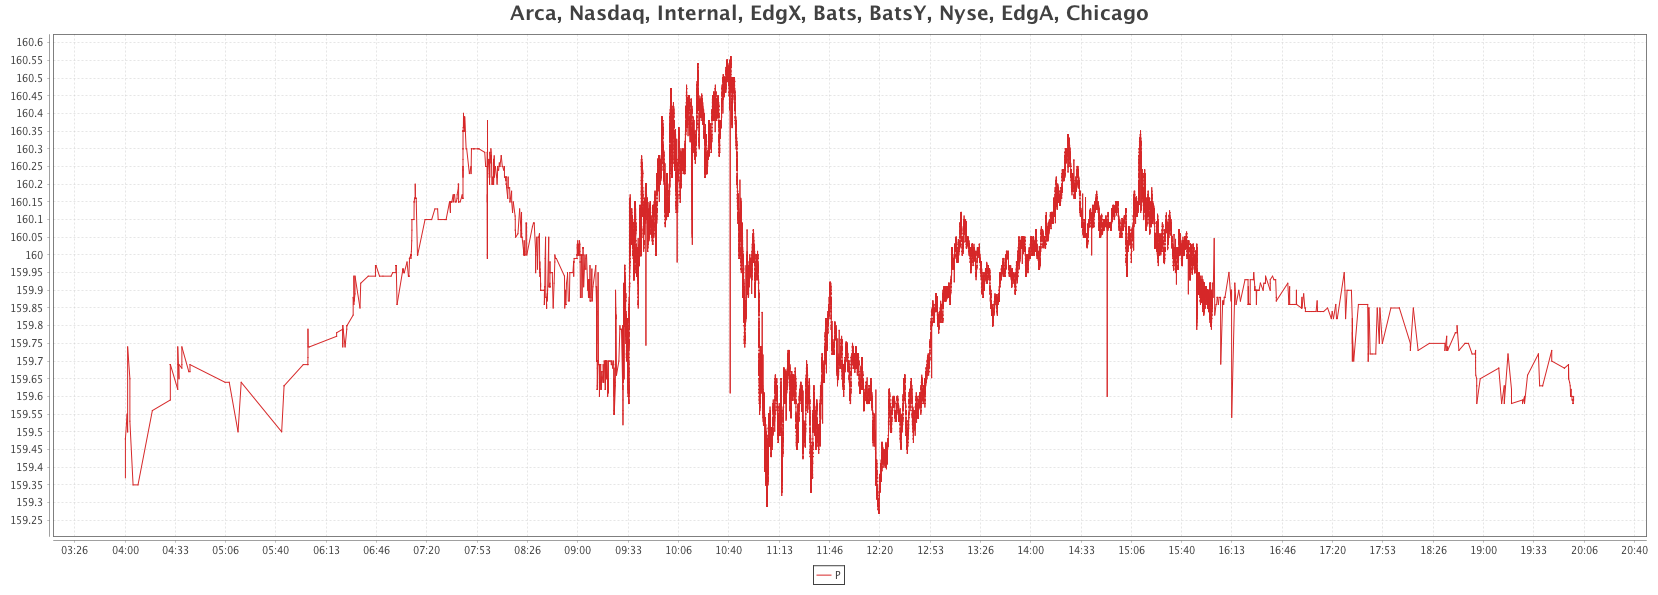
The above example shows all the values in the title column because we are passing -1 (<0) in maxRowsInTitle().
Format of the title string
By default just the comma-separated values/rows according to the maxRowsInTitle for each column are shown in the title string. This format can be customized to include column names or any other custom text along with the values.
To include the table's column names, the following syntax is used:
chartTitle(boolean showColumnNamesInTitle, Table t, String... titleColumns)
The first argument is a boolean value which determines whether to show column names in the title.
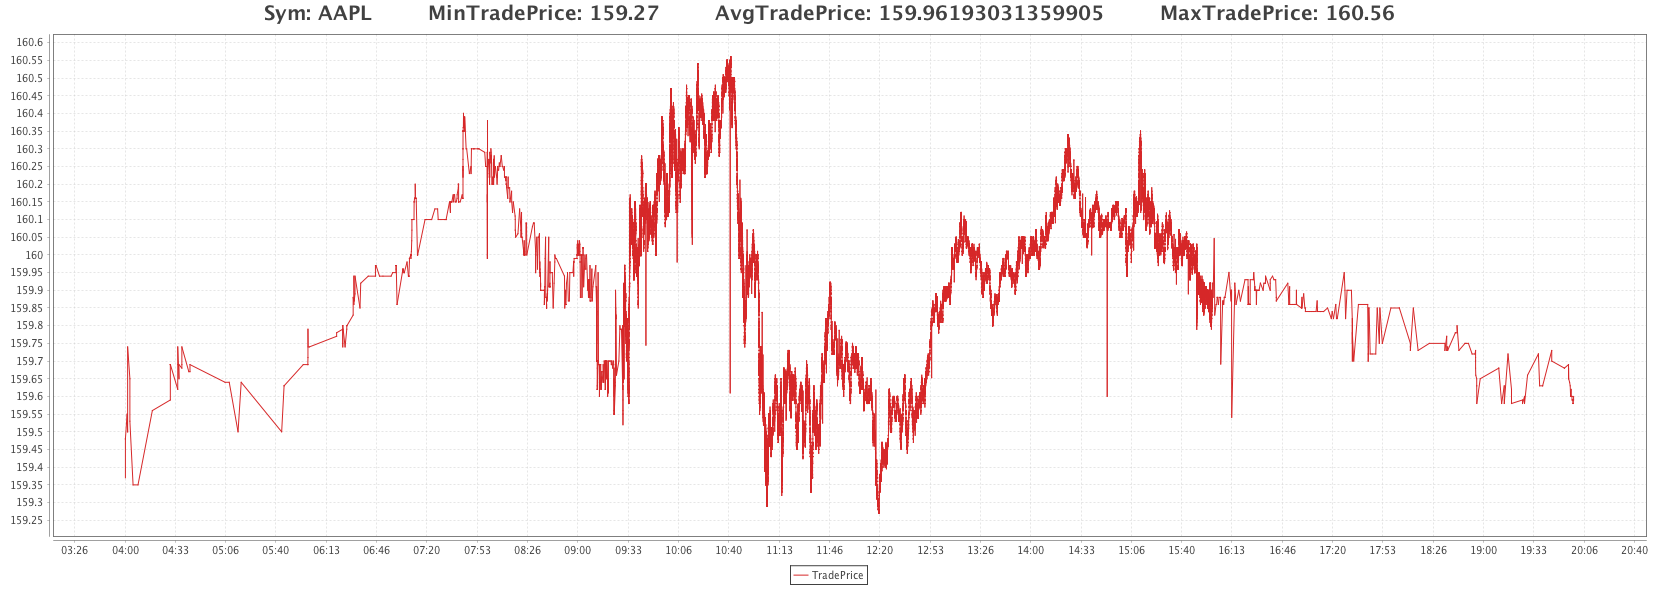
For example, the following query places column names along with the values in the chart title. As shown below, true has been passed as the first argument and hence the chart title will include the column names along with the values.
                            from deephaven import Plot
t = db.t("LearnDeephaven", "StockTrades")\
    .where("Date=`2017-08-25`", "Sym=`AAPL`")

tAgg = t.by(caf.AggCombo(caf.AggMin("MinTradePrice=Last"), caf.AggAvg("AvgTradePrice=Last"), caf.AggMax("MaxTradePrice=Last")), "Sym")

p = Plot.plot("TradePrice", t, "Timestamp", "Last")\
    .chartTitle(True, tAgg, "Sym", "MinTradePrice", "AvgTradePrice", "MaxTradePrice")\
    .show()
                            t = db.t("LearnDeephaven", "StockTrades")
	.where("Date=`2017-08-25`", "Sym=`AAPL`")

tAgg = t.by(AggCombo(AggMin("MinTradePrice=Last"), AggAvg("AvgTradePrice=Last"), AggMax("MaxTradePrice=Last")), "Sym")

p = plot("TradePrice", t, "Timestamp", "Last")
    .chartTitle(true, tAgg, "Sym", "MinTradePrice", "AvgTradePrice", "MaxTradePrice")
	.show()
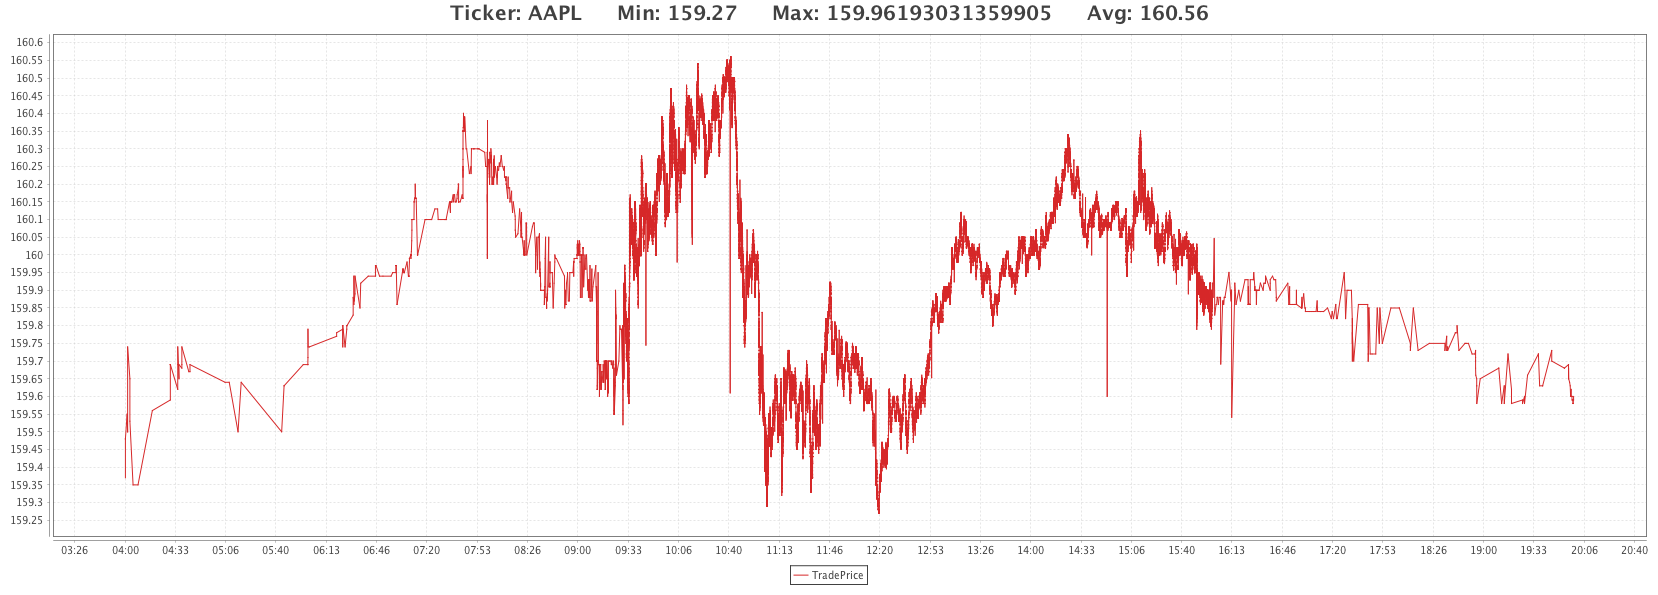
In addition to that, title format can be customized to include text along with the place holders for the column values. The basic syntax for this version of the chartTitle function follows:
chartTitle(String titleFormat, Table t, String... titleColumns)
The following example demonstrates this customization:
                            from deephaven import Plot

t = db.t("LearnDeephaven", "StockTrades")\
     .where("Date=`2017-08-25`", "Sym=`AAPL`")

tAgg = t.by(caf.AggCombo(caf.AggMin("MinTradePrice=Last"), caf.AggAvg("AvgTradePrice=Last"), caf.AggMax("MaxTradePrice=Last")), "Sym")

p = Plot.plot("TradePrice", t, "Timestamp", "Last")\
     .chartTitle("Ticker: {0}    	Min: {1}    	Max: {2}    	Avg: {3}", tAgg, "Sym", "MinTradePrice", "AvgTradePrice", "MaxTradePrice")\
     .show()
                            t = db.t("LearnDeephaven", "StockTrades")
    .where("Date=`2017-08-25`", "Sym=`AAPL`")

tAgg = t.by(AggCombo(AggMin("MinTradePrice=Last"), AggAvg("AvgTradePrice=Last"), AggMax("MaxTradePrice=Last")), "Sym")

p = plot("TradePrice", t, "Timestamp", "Last").chartTitle("Ticker: {0}    	Min: {1}    	Max: {2}    	Avg: {3}", tAgg, "Sym", "MinTradePrice", "AvgTradePrice", "MaxTradePrice")
	.show()
Summary of Methods for Dynamic Chart Titles:
|
Method signature |
Description |
|---|---|
|
|
Sets the chart title using table and title column values. The number of rows/values shown for each column considers |
|
|
Sets the chart title using table, title column names and title column values. If If |
|
|
Sets the chart title using the title format, table, and title column values. The title format follows java.text.MessageFormat. |
|
|
Sets the chart title using oneClick data source and title column values. The number of rows/values shown for each column considers |
|
|
Sets the chart title using oneClick data source, title column names and title column values. If If |
|
|
Sets the chart title using the title format, oneClick data source, and title column values. The title format follows java.text.MessageFormat |
|
|
Sets the maximum row values that will be shown in the title. The default is 0. If If |
For more information, please refer to the Javadocs.
Troubleshooting Dynamic Chart Titles for Python:
Depending on the installation of the Python wheel files associated with this release, the user may find the following exceptions:
java.lang.RuntimeException: Error in Python interpreter:
Type: <type 'exceptions.AttributeError'>
Value: 'FigureWrapper' object has no attribute 'maxRowsInTitle'
Line: 4
Namespace: <module>
File: <string>
at org.jpy.PyLib.executeCode(PyLib.java:-2)
at org.jpy.PyObject.executeCode(PyObject.java:88)
at com.illumon.iris.db.util.PythonEvaluatorJpy.evalScript(PythonEvaluatorJpy.java:47)
at com.illumon.iris.db.util.IrisDbPythonSession.lambda$evaluate$1(IrisDbPythonSession.java:144)
at com.illumon.util.locks.FunctionalLock.doLockedInterruptibly(FunctionalLock.java:45)
at com.illumon.iris.db.util.IrisDbPythonSession.evaluate(IrisDbPythonSession.java:143)
at com.illumon.iris.console.events.RemoteScriptCommandQuery.execute(RemoteScriptCommandQuery.java:94)
at com.illumon.iris.console.events.RemoteScriptCommandQuery.execute(RemoteScriptCommandQuery.java:26)
at com.illumon.iris.db.tables.remotequery.RemoteQueryProcessor$QueryAction.lambda$execute$0(RemoteQueryProcessor.java:1705)
at com.illumon.util.locks.FunctionalLock.computeLockedInterruptibly(FunctionalLock.java:80)
at com.illumon.iris.db.tables.remotequery.RemoteQueryProcessor$QueryAction.execute(RemoteQueryProcessor.java:1705)
at com.illumon.iris.db.tables.remotequery.RemoteQueryProcessor$ClientConnectionHandler.runSyncQueryAndSendResult(RemoteQueryProcessor.java:1474)
at com.illumon.iris.db.tables.remotequery.RemoteQueryProcessor$ClientConnectionHandler.handleCommandST(RemoteQueryProcessor.java:1374)
at com.illumon.iris.db.tables.remotequery.RemoteQueryProcessor$ClientConnectionHandler$HandleCommandRunnable.run(RemoteQueryProcessor.java:983)
at java.util.concurrent.Executors$RunnableAdapter.call(Executors.java:511)
at java.util.concurrent.FutureTask.run(FutureTask.java:266)
at java.util.concurrent.ThreadPoolExecutor.runWorker(ThreadPoolExecutor.java:1149)
at java.util.concurrent.ThreadPoolExecutor$Worker.run(ThreadPoolExecutor.java:624)
at java.lang.Thread.run(Thread.java:748)
The above exception indicates the Python wheel files associated with this release (a) are not installed or (b) are installed but are missing some JPY JVM flags. To eliminate this exception, you need to (a) ensure the Python wheel file associated with this release is correctly installed, and (b) pass the following JVM arguments while running your Python console
-Djpy.programName=/db/VEnvs/python27/bin/python2.7
-Djpy.pythonLib=/usr/lib64/libpython2.7.so.1.0
-Djpy.jpyLib=/db/VEnvs/python27/lib/python2.7/site-packages/jpy.so
-Djpy.jdlLib=/db/VEnvs/python27/lib/python2.7/site-packages/jdl.so
Last Updated: 16 February 2021 18:07 -04:00 UTC Deephaven v.1.20200928 (See other versions)
Deephaven Documentation Copyright 2016-2020 Deephaven Data Labs, LLC All Rights Reserved