+New
Clicking the New button in the navigation bar opens the new tab screen, that provides options to create new Code Studios, Dashboards, and Query Monitors, and to access any saved workspaces or Query Monitors.
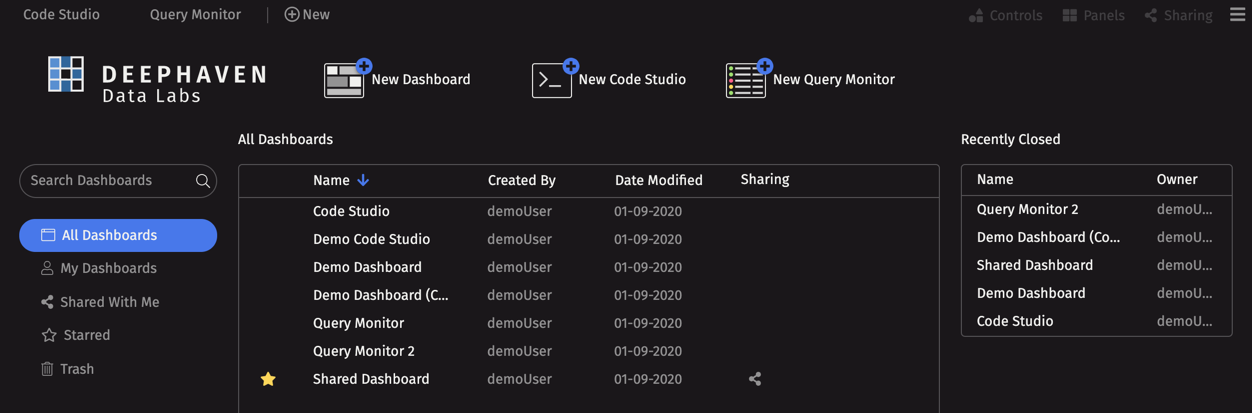
At the top of the panel is the Deephaven logo followed by the New Dashboard button, the New Code Studio button, and the New Query Monitor button.
Below that on the left is a field you can use to search for existing workspaces or Query Monitors, and buttons for reviewing All Dashboards, My Dashboards, Shared with Me, Starred and Trash.
- Search Dashboards - To search for an existing Dashboard, Code Studio or Query Monitor, or the name of the owner, simply type the characters into the Search Dashboard field. As you type, a list of matching results will appear in the center portion of the window. (Note: Only dashboards that you are authorized to view will appear in the list.)
- All Dashboards is the default value. When it is selected, all of the workspaces you are allowed to see will appear in the center part of that panel.
- My Dashboards - Selecting this option will show a list of all of the workspaces you created.
- Shared with Me - Selecting this option will show a list of all of the Dashboards others have created and shared with you.
- Starred - Selecting this option will show a list of all of the workspaces to which you have applied a "star" (for quick access). See the next section for information about applying a "star" to a dashboard.
- Trash - Selecting this option will show a list of all of the workspaces you have discarded. The list also provides options for restoring deleted workspaces. See Trash Can below for additional information and features.
In the center of the window is a section that lists the workspace names (as selected by the buttons on the left side). Because All Dashboards is the default value on the left, the list will show all of the names of dashboards for which you have access. In the example below, five dashboards are shown. To open any of the dashboards listed, click on the dashboard's name.
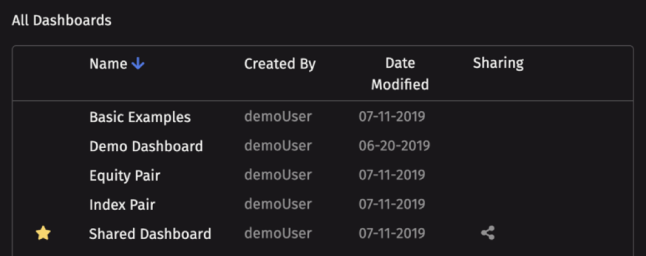
The blue downward pointing arrow by the Name heading at the top of the list means this list is sorted in descending order based on the value in the Name column. Clicking the heading a second time will sort the list in ascending order. You can click any heading to sort the list.
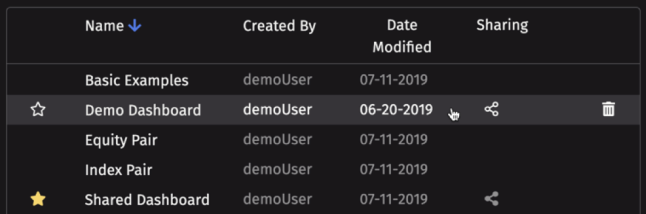
When you hover your cursor over a dashboard name, additional features are presented in the row for that dashboard, as shown below.
Star
When the star to the left of the dashboard name is selected, it will become yellow, as shown below.
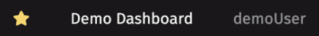
Dashboards that have been assigned a star will also appear when the Starred button is selected on the left side of the window. The purpose of this feature is to enable a user to make certain dashboards more readily visible/findable, especially if there are many dashboards in their list.
Created By
This heading shows the username of the person/group who created this dashboard.
Date Modified
This heading shows the date of the last time the dashboard has been modified.
Sharing
This column allows you to see if the dashboard is shared with another user. If so, the "Share" icon appears in the row, as shown below. If you are not the owner or do not have admin permissions on a dashboard, the icon will not appear. Selecting the icon opens the Share modal. See Sharing Dashboards for more information.

Copy
When a workspace is selected, the copy icon will become available if you have the appropriate permissions. Select the copy button to create an identical copy of the workspace or Query Monitor, which will be added to the All Dashboards list.

If the selected dashboard can be deleted, a trash can icon appears in the row, as shown below. You can only delete dashboards that you own, not dashboards shared with you by others. Deleting a dashboards will make it inaccessible for all users with which that dashboard was shared.
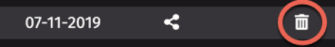
Selecting the icon will generate a confirmation dialog. Select Cancel to return to the previous panel or select Delete to delete the selected dashboard. If you choose Delete, a confirmation dialog will appear as shown below.
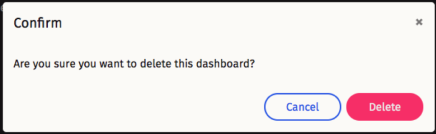
Once a dashboard is deleted in this manner, it will appear when the Trash button is selected from the left side of the panel, as shown below. Deleted dashboards can be restored by selecting the counter-clockwise round arrow icon on the right, as shown below.
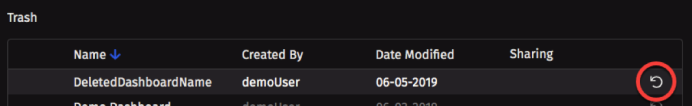
Hovering over the icon will generate a Restore tooltip as shown below. Selecting the icon will restore the dashboard to active status.

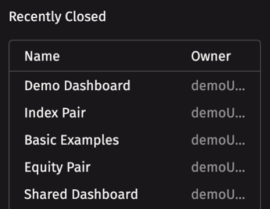
Recently Closed
On the right side of the window is a list of Recently Closed dashboards. To access a recently closed dashboard, simply click on the dashboard name.
Last Updated: 16 February 2021 18:07 -04:00 UTC Deephaven v.1.20200928 (See other versions)
Deephaven Documentation Copyright 2016-2020 Deephaven Data Labs, LLC All Rights Reserved