Practical Examples
In addition to the code snippets included below, all of the Groovy and Python code for the recipes below can be downloaded as premade Deephaven Notebooks. To learn more about using Deephaven Notebooks, please refer to the Notebook section of the User Manual.
Download the Query Cookbook Notebooks
Downsampling Trades
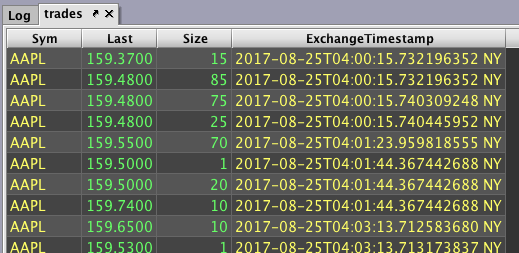
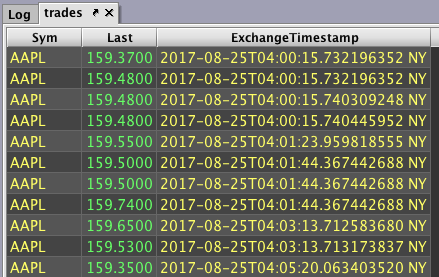
Step 1: Pull trades for a certain date and remove some columns.
trades = db.t("LearnDeephaven", "StockTrades")
.where("Date=`2017-08-25`")
.view("Sym", "Last", "Size", "ExchangeTimestamp")
Step 2: Decide the value for downsampling and create a new column to hold those values
To downsample our trades, we need to decide on the time intervals to which we want to downsample. For this example, we will specify one minute.
tradesByMin = trades.updateView("MinuteTimeBin=lowerBin(ExchangeTimestamp, MINUTE)")
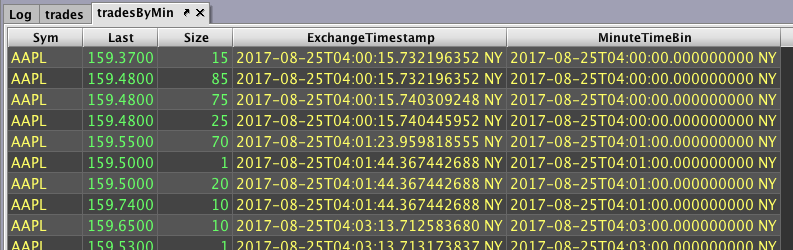
We haven't downsampled yet. We've simply added a column to bin the time, which is the closest whole minute (rounding down).
Step 3: Downsample trades based on the closest minute after the trade is completed.
downsample = tradesByMin.firstBy("Sym", "MinuteTimeBin")
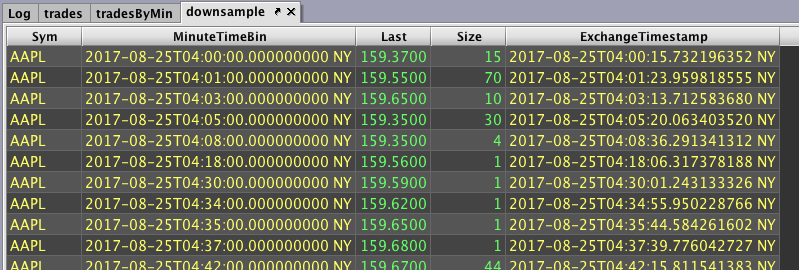
This query keeps the first trade for each symbol that occurred every minute and discards any other trades for that symbol during that same minute. The table now shows only one trade per minute per symbol.
Note: This recipes downsamples trades to the first trade of each minute by using lowerBin and firstBy(). However, one could downsample to the last trade each minute by using upperBin and lastBy().
Complete Code Blocks for the Downsampling Trades Recipe
trades = db.t("LearnDeephaven", "StockTrades")
     .where("Date=`2017-08-25`")
     .view("Sym", "Last", "Size", "ExchangeTimestamp")

tradesByMin = trades.updateView("MinuteTimeBin=lowerBin(ExchangeTimestamp, MINUTE)")

downsample = tradesByMin.firstBy("Sym", "MinuteTimeBin")
# Initial import
from deephaven import *
print("Provides:\n"
"\tdeephaven.Calendars as cals\n"
"\tdeephaven.ComboAggregateFactory as caf\n"
"\tdeephaven.DBTimeUtils as dbtu\n"
"\tdeephaven.Plot as plt\n"
"\tdeephaven.Plot.figure_wrapper as figw\n"
"\tdeephaven.QueryScope as qs\n"
"\tdeephaven.TableManagementTools as tmt\n"
"\tdeephaven.TableTools as ttools\n"
"See print(sorted(dir())) for the full namespace contents.")
# Downsampling Trades
trades = db.t("LearnDeephaven", "StockTrades")\
.where("Date=`2017-08-25`")\
.view("Sym", "Last", "Size", "ExchangeTimestamp")
tradesByMin = trades.updateView("MinuteTimeBin=lowerBin(ExchangeTimestamp, MINUTE)")
downsample = tradesByMin.firstBy("Sym", "MinuteTimeBin")
Price Volatility
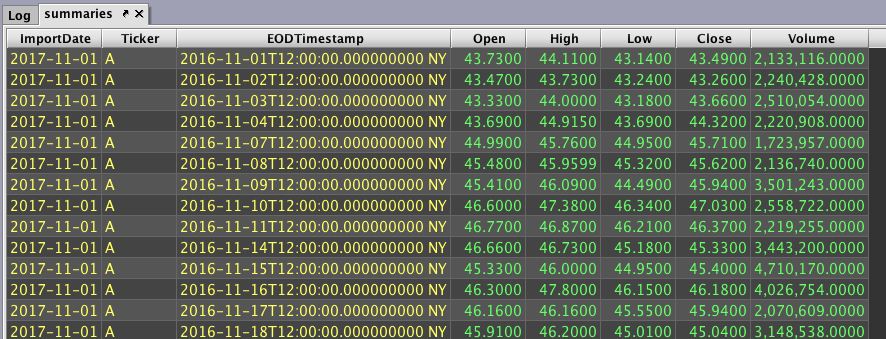
Step 1: Pull day-by-day trade summaries for each symbol over a year.
summaries = db.t("LearnDeephaven", "EODTrades").where("ImportDate=`2017-11-01`")
Step 2: Calculate daily return for rows with the same ticker value.
returns = summaries.updateView("Return=(Ticker=Ticker_[i-1]) ? log(Close/Close_[i-1]) : NULL_DOUBLE")
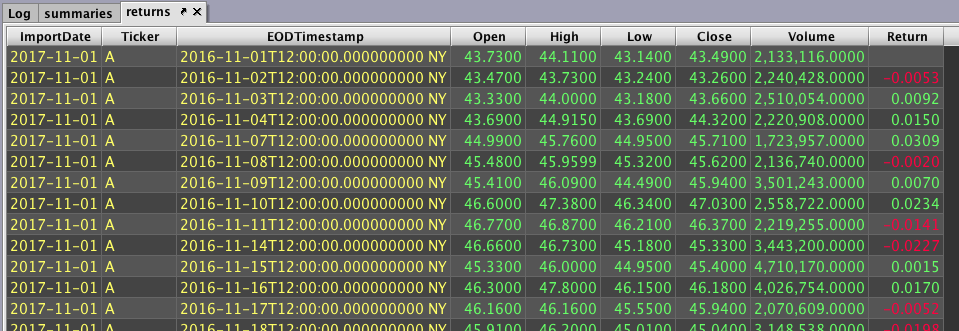
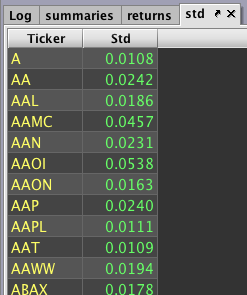
Step 3: Calculate standard deviation of returns for each symbol.
std = returns.view("Ticker", "Std=Return").stdBy("Ticker")
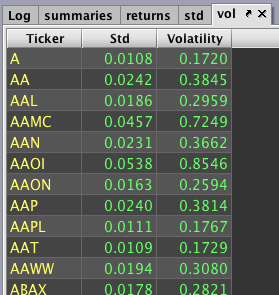
Step 4: Create a constant for the annualization factor.
trading_days = 252
annualization = sqrt(trading_days)
Step 5: Calculate volatility.
vol = std.updateView("Volatility=annualization*Std")
Complete Code Blocks for the Price Volatility Recipe
summaries = db.t("LearnDeephaven", "EODTrades").where("ImportDate=`2017-11-01`")
returns = summaries.updateView("Return=(Ticker=Ticker_[i-1]) ? log(Close/Close_[i-1]) : NULL_DOUBLE")
std = returns.view("Ticker", "Std=Return").stdBy("Ticker")
trading_days = 252
annualization = sqrt(trading_days)
vol = std.updateView("Volatility=annualization*Std")
# Initial import
from deephaven import *
# Price Volatility
summaries = db.t("LearnDeephaven", "EODTrades").where("ImportDate=`2017-11-01`")
returns = summaries.updateView("Return=(Ticker=Ticker_[i-1]) ? log(Close/Close_[i-1]) : NULL_DOUBLE")
std = returns.view("Ticker", "Std=Return").stdBy("Ticker")
trading_days = 252
annualization = trading_days ** 0.5
vol = std.updateView("Volatility=annualization*Std")
Returns
Step 1: Pull trades for a certain date and remove some columns.
trades = db.t("LearnDeephaven", "StockTrades")
.where("Date=`2017-08-25`")
.view("Sym", "Last", "ExchangeTimestamp")
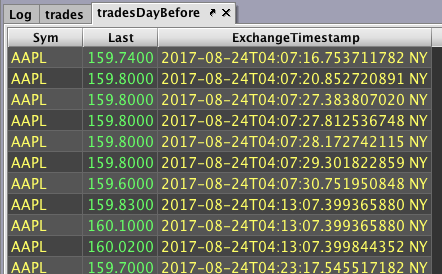
Step 2: Pull trades for the day before and remove some columns.
tradesDayBefore = db.t("LearnDeephaven", "StockTrades")
.where("Date=`2017-08-24`")
.view("Sym", "Last", "ExchangeTimestamp")
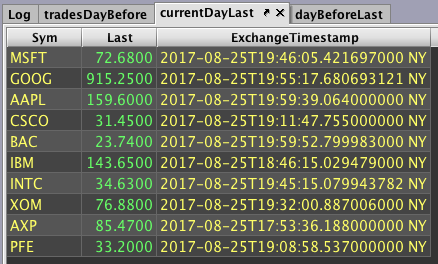
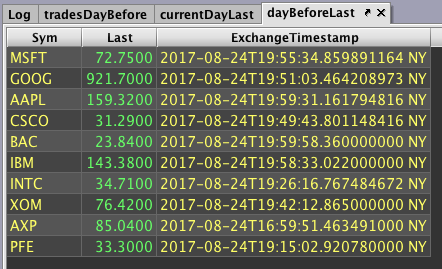
Step 3: Get the last trade for each symbol on both days.
currentDayLast = trades.lastBy("Sym")
dayBeforeLast = tradesDayBefore.lastBy("Sym")
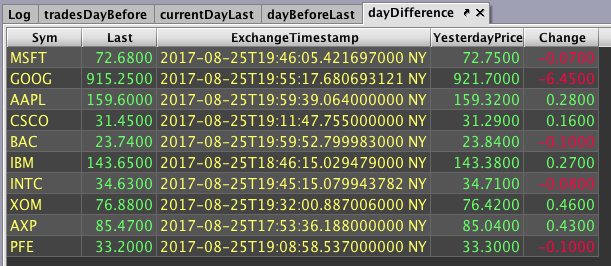
Step 4: Join the last trade price from the day before to the current and subtract their prices.
dayDifference = currentDayLast.exactJoin(dayBeforeLast, "Sym", "YesterdayPrice=Last")
.updateView("Change=Last-YesterdayPrice")
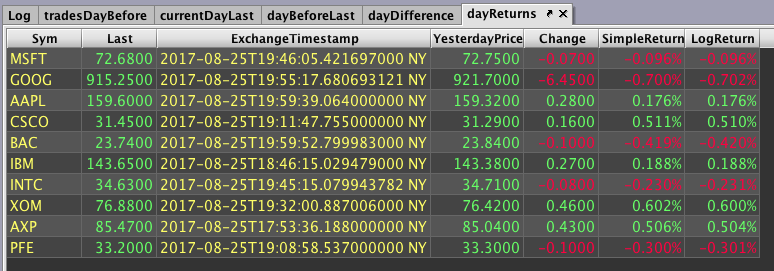
Step 5: Calculate returns from the day before and format them to percentages.
dayReturns = dayDifference.updateView("SimpleReturn=Change/YesterdayPrice", "LogReturn=log(Last/YesterdayPrice)")
.formatColumns("SimpleReturn=Decimal(`0.000%`)", "LogReturn=Decimal(`0.000%`)")
Next, we need to calculate the hourly returns. This is accomplished over the next three steps.
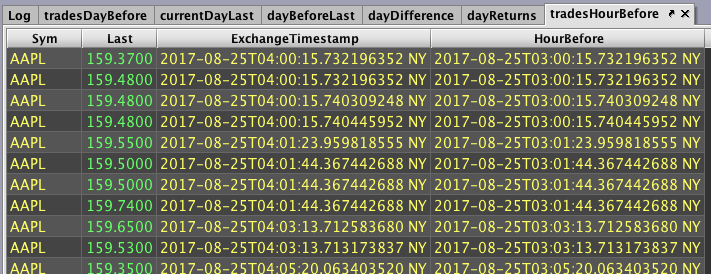
Step 6: Add a column that holds time values one hour before the ExchangeTimestamp column.
tradesHourBefore = trades.updateView("HourBefore=ExchangeTimestamp - HOUR")
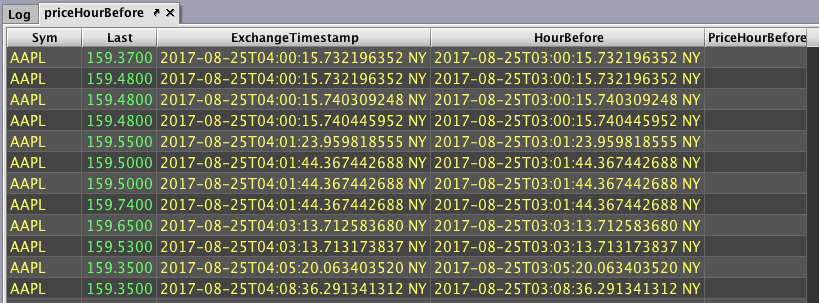
Step 7: For each row under a given symbol, join the most recent price by the modified time.
priceHourBefore = tradesHourBefore.aj(tradesHourBefore, "Sym, HourBefore=ExchangeTimestamp", "PriceHourBefore=Last")
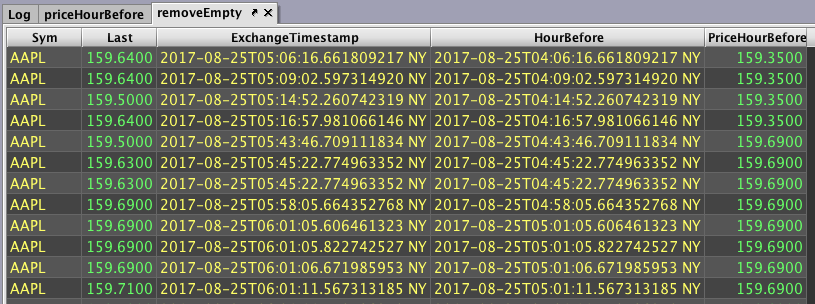
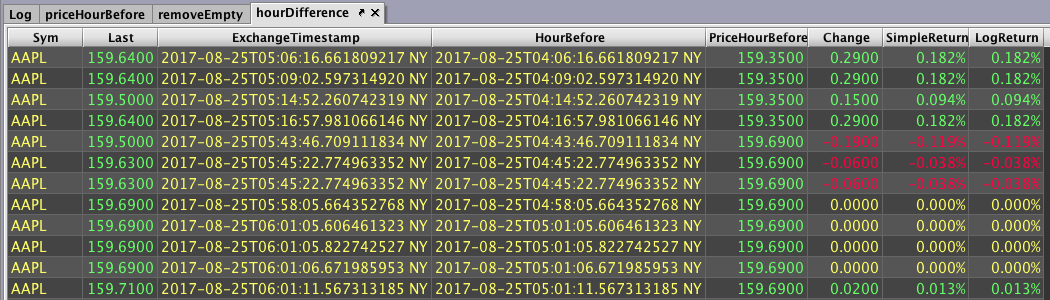
Step 8: To get a better look at the result, let's get rid of of any rows with empty cells.
Note: The exclamation point changes the meaning of a method. For example, in the previous query, rather than checking if PriceHourBefore is null, you're checking if PriceHourBefore is not null.
removeEmpty = priceHourBefore.where("!isNull(PriceHourBefore)")
Step 9: Calculate hourly returns.
hourDifference = removeEmpty.updateView("Change=Last-PriceHourBefore", "SimpleReturn=Change/PriceHourBefore", "LogReturn=log(Last/PriceHourBefore)")
.formatColumns("SimpleReturn=Decimal(`0.000%`)", "LogReturn=Decimal(`0.000%`)")
Complete Code Blocks for the Returns Recipe
trades = db.t("LearnDeephaven", "StockTrades")
     .where("Date=`2017-08-25`")
     .view("Sym", "Last", "ExchangeTimestamp")

tradesDayBefore = db.t("LearnDeephaven", "StockTrades")
     .where("Date=`2017-08-24`")
     .view("Sym", "Last", "ExchangeTimestamp")

currentDayLast = trades.lastBy("Sym")
dayBeforeLast = tradesDayBefore.lastBy("Sym")

dayDifference = currentDayLast.exactJoin(dayBeforeLast, "Sym", "YesterdayPrice=Last")
     .updateView("Change=Last-YesterdayPrice")

dayReturns = dayDifference.updateView("SimpleReturn=Change/YesterdayPrice", "LogReturn=log(Last/YesterdayPrice)")
     .formatColumns("SimpleReturn=Decimal(`0.000%`)", "LogReturn=Decimal(`0.000%`)")

tradesHourBefore = trades.updateView("HourBefore=ExchangeTimestamp - HOUR")

priceHourBefore = tradesHourBefore.aj(tradesHourBefore, "Sym, HourBefore=ExchangeTimestamp", "PriceHourBefore=Last")

removeEmpty = priceHourBefore.where("!isNull(PriceHourBefore)")
hourDifference = removeEmpty.updateView("Change=Last-PriceHourBefore", "SimpleReturn=Change/PriceHourBefore", "LogReturn=log(Last/PriceHourBefore)")
     .formatColumns("SimpleReturn=Decimal(`0.000%`)", "LogReturn=Decimal(`0.000%`)")
# Initial import
from deephaven import *
# Returns
trades = db.t("LearnDeephaven", "StockTrades")\
.where("Date=`2017-08-25`")\
.view("Sym", "Last", "ExchangeTimestamp")
tradesDayBefore = db.t("LearnDeephaven", "StockTrades")\
.where("Date=`2017-08-24`")\
.view("Sym", "Last", "ExchangeTimestamp")
currentDayLast = trades.lastBy("Sym")
dayBeforeLast = tradesDayBefore.lastBy("Sym")
dayDifference = currentDayLast.exactJoin(dayBeforeLast, "Sym", "YesterdayPrice=Last")\
.updateView("Change=Last-YesterdayPrice")
dayReturns = dayDifference.updateView("SimpleReturn=Change/YesterdayPrice", "LogReturn=log(Last/YesterdayPrice)")\
.formatColumns("SimpleReturn=Decimal(`0.000%`)", "LogReturn=Decimal(`0.000%`)")
tradesHourBefore = trades.updateView("HourBefore=ExchangeTimestamp - HOUR")
priceHourBefore = tradesHourBefore.aj(tradesHourBefore, "Sym, HourBefore=ExchangeTimestamp", "PriceHourBefore=Last")
removeEmpty = priceHourBefore.where("!isNull(PriceHourBefore)")
hourDifference = removeEmpty.updateView("Change=Last-PriceHourBefore", "SimpleReturn=Change/PriceHourBefore", "LogReturn=log(Last/PriceHourBefore)")\
.formatColumns("SimpleReturn=Decimal(`0.000%`)", "LogReturn=Decimal(`0.000%`)")
Pair Trading Analysis
Step 1: Write custom code to calculate rolling averages and standard deviations.
Custom code will be needed later to calculate rolling averages and standard deviations. Let's write these functions first.
rollingAvg = { rows, values ->
calculations = new double[values.size()]
sum = 0
n = 0
for (long i = 0; i < values.size(); ++i)
{
if (i < rows) n++ //n increments with i until n=rows
sum += values.get(i) //add each value to sum
if (i >= rows) sum -= values.get((long)(i - rows)) //subtract when needed
calculations[(int)i] = sum/n //store running average
}
return calculations //return an array of rolling averages
}
rollingStd = { rows, values ->
// NOTE: variance(X) is most efficiently calculated as E(X^2) - E(X)^2
calculations = new double[values.size()]
n = 0
sum = 0
sum2 = 0
for (long i = 0; i < values.size(); ++i)
{
if (i < rows) n++ //n increments with i until n=rows
val = values.get(i)
sum2 += val*val
sum += val
if (i >= rows){
val = values.get((long)(i - rows))
sum -= val //subtract when needed
sum2 -= val*val
}
variance = sum2/n - (sum*sum)/(n*n)
calculations[(int)i] = (variance > 0) ? Math.sqrt(variance): 0 // account for numerical imprecision near 0
}
return calculations
}
Step 2: Start the query script to select two symbols to compare and the latest date to use in the analysis.
pair = ["MSFT", "GOOG"]
latestDate = "2017-08-21"
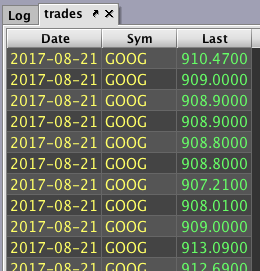
Step 3: Pull all trades from the latest date onwards for the specified symbols and reduce the table.
trades = db.t("LearnDeephaven", "StockTrades")
.where("Date>=latestDate", "Sym in pair")
.view("Date", "Sym", "Last")
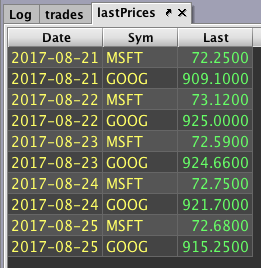
Step 4: Get the last trade price for each day and each symbol.
lastPrices = trades.by(AggCombo(AggLast("Last")), "Date", "Sym")
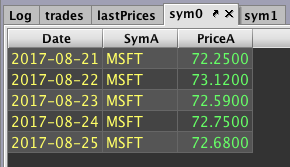
Step 5: Create two tables, each containing trades for a single symbol and rename their columns.
sym0 = lastPrices.where("Sym=pair[0]")
.renameColumns("SymA=Sym", "PriceA=Last")
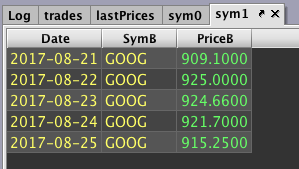
sym1 = lastPrices.where("Sym=pair[1]")
.renameColumns("SymB=Sym", "PriceB=Last")
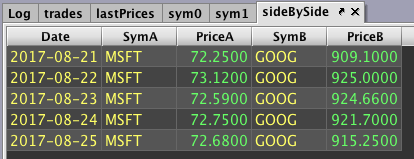
Step 6: Join these tables together so their prices can be side-by-side.
sideBySide = sym0.naturalJoin(sym1, "Date")
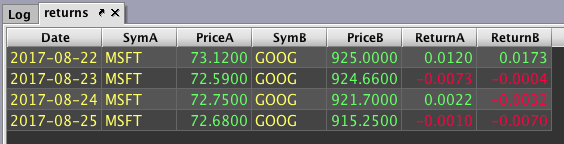
Step 7: Calculate daily returns and drop the row without a return.
This will show us how correlated the symbols' returns are before we analyze the pair's prices.
returns = sideBySide.updateView("ReturnA=log(PriceA/PriceA_[i-1])", "ReturnB=log(PriceB/PriceB_[i-1])")
.where("!isNull(ReturnA) && !isNull(ReturnB)")
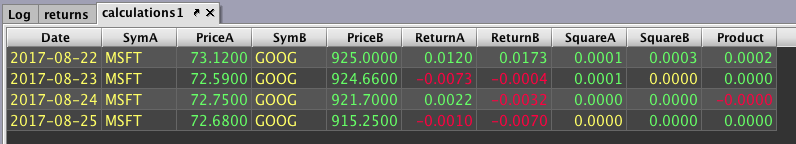
Step 8: Calculate the square and product for each row.
calculations1 = returns.updateView("SquareA=ReturnA*ReturnA", "SquareB=ReturnB*ReturnB", "Product=ReturnA*ReturnB")
Step 9: Calculate the count and the sum of returns, squares, and products.
calculations2 = calculations1.by(AggCombo(AggCount("N"), AggSum("ReturnA", "ReturnB", "SquareA", "SquareB", "Product")))
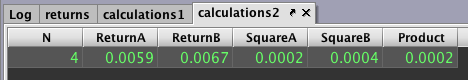
All the information needed to calculate the correlation is now available.
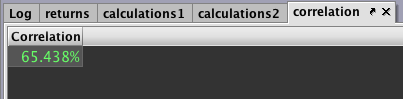
Step 10: Calculate the correlation.
correlation = calculations2.view("Correlation=((N * Product) - (ReturnA * ReturnB)) / sqrt((N * SquareA - pow(ReturnA, 2)) * (N * SquareB - pow(ReturnB, 2)))")
.formatColumns("Correlation=Decimal(`0.000%`)")
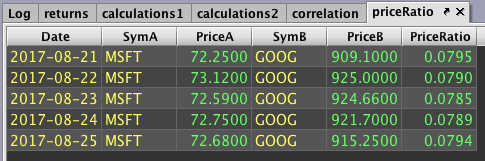
Step 11: Return to the pair analysis. Calculate the price ratio from the sideBySide table.
priceRatio = sideBySide.updateView("PriceRatio=PriceA/PriceB")
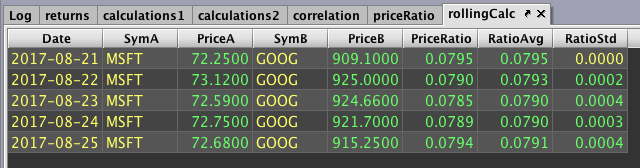
Step 12: Calculate rolling average and standard deviation using our custom functions.
rollingCalc = priceRatio.by()
.updateView("RatioAvg=(double[])rollingAvg.call(20, PriceRatio)", "RatioStd=(double[])rollingStd.call(20, PriceRatio)")
.ungroup()
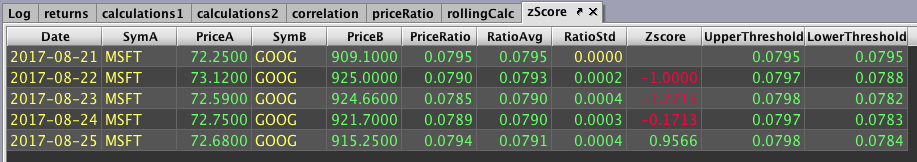
Step 13: Calculate z-score as well as values two z-scores above and under average.
zScore = rollingCalc.updateView("Zscore=(RatioStd != 0) ? (PriceRatio-RatioAvg)/RatioStd: NULL_DOUBLE",
"UpperThreshold=RatioAvg+2*RatioStd", "LowerThreshold=RatioAvg-2*RatioStd")
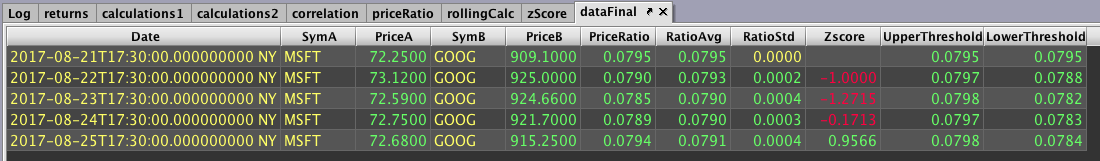
Step 14: To create time plots for visualizing the data, we first need to convert our dates to the proper time format.
dataFinal = zScore.updateView("Date=convertDateTime(Date+`T17:30 NY`)")
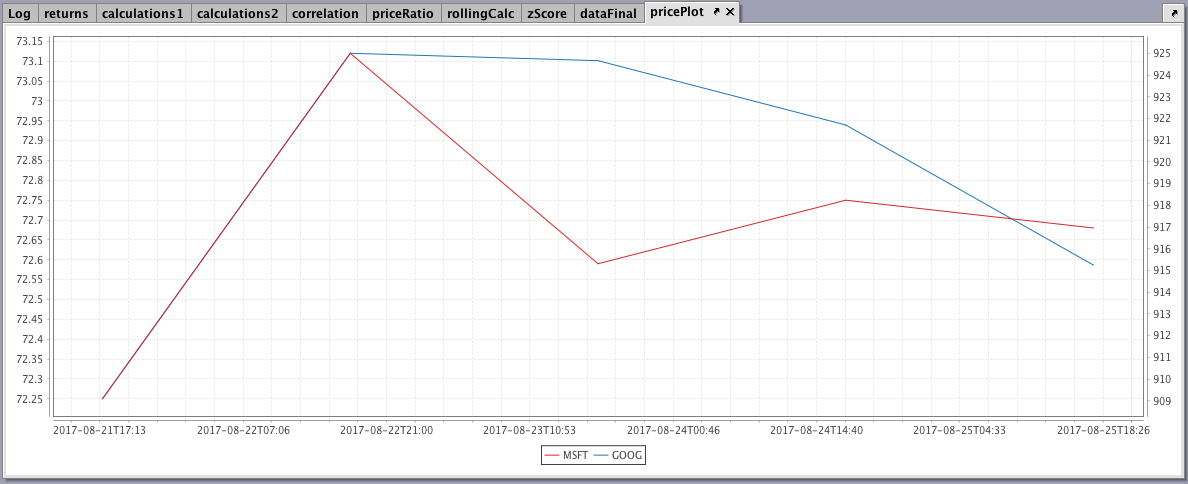
Step 15: Create a dual time plot for the symbols' prices.
pricePlot = plot(pair[0], dataFinal, "Date", "PriceA")
.twinX().plot(pair[1], dataFinal, "Date", "PriceB").show()
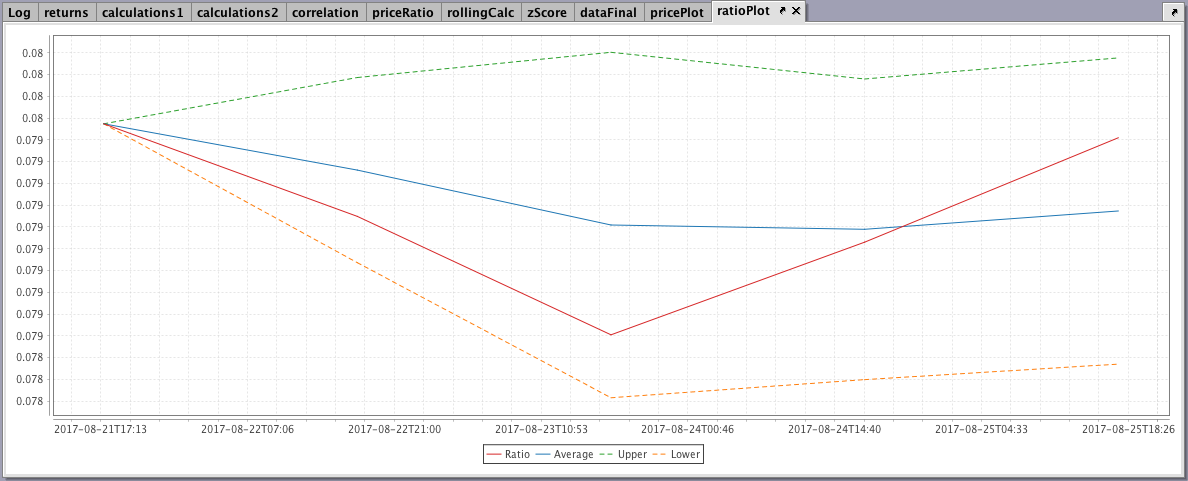
Step 16: Finally, create a time plot for our price ratio, average, and upper/lower thresholds.
ratioPlot = plot("Ratio", dataFinal, "Date", "PriceRatio")
.plot("Average", dataFinal, "Date", "RatioAvg")
.plot("Upper", dataFinal, "Date", "UpperThreshold")
.lineStyle(lineStyle([4,4]))
.plot("Lower", dataFinal, "Date", "LowerThreshold")
.lineStyle(lineStyle([4,4]))
.show()
Complete Code Blocks for the Pairs Trading Analysis Recipe
rollingAvg = { rows, values ->
    calculations = new double[values.size()]
    sum = 0
    n = 0

    for (long i = 0; i < values.size(); ++i)
    {
        if (i < rows) n++ //n increments with i until n=rows

        sum += values.get(i) //add each value to sum
        if (i >= rows) sum -= values.get((long)(i - rows)) //subtract when needed

        calculations[(int)i] = sum/n //store running average
    }
    return calculations //return an array of rolling averages
    }

rollingStd = { rows, values ->
    // NOTE: variance(X) is most efficiently calculated as E(X^2) - E(X)^2
    calculations = new double[values.size()]
    n = 0
    sum = 0
    sum2 = 0

    for (long i = 0; i < values.size(); ++i)
    {
        if (i < rows) n++ //n increments with i until n=rows
        val = values.get(i)
        sum2 += val*val
        sum += val

        if (i >= rows){
            val = values.get((long)(i - rows))
            sum -= val //subtract when needed
            sum2 -= val*val
    }

    variance = sum2/n - (sum*sum)/(n*n)
    calculations[(int)i] = (variance > 0) ? Math.sqrt(variance): 0 // account for numerical imprecision near 0
    }

    return calculations
}

pair = ["MSFT", "GOOG"]
latestDate = "2017-08-21"

trades = db.t("LearnDeephaven", "StockTrades")
     .where("Date>=latestDate", "Sym in pair")
     .view("Date", "Sym", "Last")

lastPrices = trades.by(AggCombo(AggLast("Last")), "Date", "Sym")

sym0 = lastPrices.where("Sym=pair[0]")
     .renameColumns("SymA=Sym", "PriceA=Last")
sym1 = lastPrices.where("Sym=pair[1]")
     .renameColumns("SymB=Sym", "PriceB=Last")

sideBySide = sym0.naturalJoin(sym1, "Date")

returns = sideBySide.updateView("ReturnA=log(PriceA/PriceA_[i-1])", "ReturnB=log(PriceB/PriceB_[i-1])")
     .where("!isNull(ReturnA) && !isNull(ReturnB)")

calculations1 = returns.updateView("SquareA=ReturnA*ReturnA", "SquareB=ReturnB*ReturnB", "Product=ReturnA*ReturnB")

calculations2 = calculations1.by(AggCombo(AggCount("N"), AggSum("ReturnA", "ReturnB", "SquareA", "SquareB", "Product")))

correlation = calculations2.view("Correlation=((N * Product) - (ReturnA * ReturnB)) / sqrt((N * SquareA - pow(ReturnA, 2)) * (N * SquareB - pow(ReturnB, 2)))")
     .formatColumns("Correlation=Decimal(`0.000%`)")

priceRatio = sideBySide.updateView("PriceRatio=PriceA/PriceB")

rollingCalc = priceRatio.by()
     .updateView("RatioAvg=(double[])rollingAvg.call(20, PriceRatio)", "RatioStd=(double[])rollingStd.call(20, PriceRatio)")
     .ungroup()

zScore = rollingCalc.updateView("Zscore=(RatioStd != 0) ? (PriceRatio-RatioAvg)/RatioStd: NULL_DOUBLE",
    "UpperThreshold=RatioAvg+2*RatioStd", "LowerThreshold=RatioAvg-2*RatioStd")

dataFinal = zScore.updateView("Date=convertDateTime(Date+`T17:30 NY`)")

pricePlot = plot(pair[0], dataFinal, "Date", "PriceA")
     .twinX()
     .plot(pair[1], dataFinal, "Date", "PriceB")
     .show()

ratioPlot = plot("Ratio", dataFinal, "Date", "PriceRatio")
     .plot("Average", dataFinal, "Date", "RatioAvg")
     .plot("Upper", dataFinal, "Date", "UpperThreshold")
     .lineStyle(lineStyle([4,4]))
     .plot("Lower", dataFinal, "Date", "LowerThreshold")
     .lineStyle(lineStyle([4,4]))
     .show()
# Initial import
from deephaven import *
# Pair Trading Analysis
def rollingAvg(rows, values):
calculations = jpy.array('double', values.size()) # create an array of doubles
sum = 0
n = 0
for i in range(values.size()):
if (i < rows): n += 1 # n increments with i until n = rows
sum += values.get(i) # add each value to sum
if (i >= rows): sum -= values.get(i - rows) # subtract when needed
avg = sum/n # get updated average every iteration
calculations[i] = avg # store running average
return calculations # return an array of rolling averages
def rollingStd(rows, values):
# Can we use numpy and convolution here instead?
# some other kind of vectorization?
calculations = jpy.array('double', values.size()) # create an array of doubles
sum2 = 0
sum = 0
n = 0
for i in range(values.size()):
if (i < rows): n += 1 # n increments with i until n=rows
val = values.get(i)
sum += val
sum2 += val*val
if i >= rows:
# subtract when needed
val = values.get(i-rows)
sum -= val
sum2 -= val*val
variance = sum2/n - (sum*sum/(n*n))
calculations[i] = variance**0.5 if variance > 0 else 0 # account for numerical precision near 0
return calculations
pair = jpy.array('java.lang.String', 2)
pair[0] = "MSFT"
pair[1] = "GOOG"
latestDate = "2017-08-21"
trades = db.t("LearnDeephaven", "StockTrades")\
.where("Date>=latestDate", "Sym in pair")\
.view("Date", "Sym", "Last")
lastPrices = trades.by(caf.AggCombo(caf.AggLast("Last")), "Date", "Sym")
sym0 = lastPrices.where("Sym=pair[0]")\
.renameColumns("SymA=Sym", "PriceA=Last")
sym1 = lastPrices.where("Sym=pair[1]")\
.renameColumns("SymB=Sym", "PriceB=Last")
sideBySide = sym0.naturalJoin(sym1, "Date")
returns = sideBySide.updateView("ReturnA=log(PriceA/PriceA_[i-1])", "ReturnB=log(PriceB/PriceB_[i-1])")\
.where("!isNull(ReturnA) && !isNull(ReturnB)")
calculations1 = returns.updateView("SquareA=ReturnA*ReturnA", "SquareB=ReturnB*ReturnB", "Product=ReturnA*ReturnB")
calculations2 = calculations1.by(caf.AggCombo(caf.AggCount("N"), caf.AggSum("ReturnA", "ReturnB", "SquareA", "SquareB", "Product")))
correlation = calculations2.view("Correlation=(N * (Product - (ReturnA * ReturnB))) / sqrt((N * SquareA - pow(ReturnA, 2)) * (N * SquareB - pow(ReturnB, 2)))")\
.formatColumns("Correlation=Decimal(`0.000%`)")
priceRatio = sideBySide.updateView("PriceRatio=PriceA/PriceB")
rollingCalc = priceRatio.by()\
.updateView("RatioAvg=(double[])rollingAvg.call(20, PriceRatio)", "RatioStd=(double[])rollingStd.call(20, PriceRatio)")\
.ungroup()
zScore = rollingCalc.updateView("Zscore=(PriceRatio-RatioAvg)/RatioStd", "UpperThreshold=RatioAvg+2*RatioStd", "LowerThreshold=RatioAvg-2*RatioStd")
dataFinal = zScore.updateView("Date=convertDateTime(Date+`T17:30 NY`)")Mean Reversion Simulation
Step 1: Write functions to calculate rolling averages and standard deviations.
Custom code will be needed later to calculate rolling averages and standard deviations. Let's write these functions first.
rollingAvg = { rows, values ->
calculations = new double[values.size()]
sum = 0
n = 0
for (long i = 0; i < values.size(); ++i)
{
if (i < rows) n++ //n increments with i until n=rows
sum += values.get(i) //add each value to sum
if (i >= rows) sum -= values.get((long)(i - rows)) //subtract when needed
calculations[(int)i] = sum/n //store running average
}
return calculations //return an array of rolling averages
}
rollingStd = { rows, values ->
// NOTE: variance(X) is most efficiently calculated as E(X^2) - E(X)^2
calculations = new double[values.size()]
n = 0
sum = 0
sum2 = 0
for (long i = 0; i < values.size(); ++i)
{
if (i > rows) n++ //n increments with i until n=rows
val = values.get(i)
sum2 += val*val
sum += val
if (i >= rows){
val = values.get((long)(i - rows))
sum -= val //subtract when needed
sum2 -= val*val
}
variance = sum2/n - (sum*sum)/(n*n)
calculations[(int)i] = (variance > 0) ? Math.sqrt(variance): 0 // account for numerical imprecision near 0
}
return calculations
}
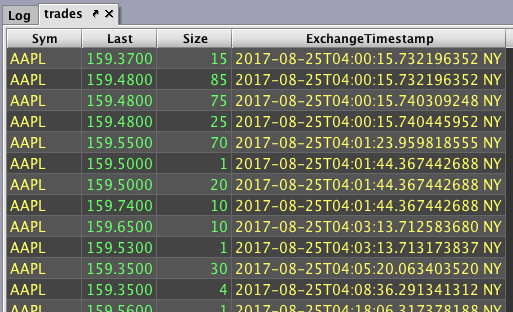
Step 2: Pull trades from a certain date and reduce the table:
trades = db.t("LearnDeephaven", "StockTrades")
.where("Date=`2017-08-25`")
.view("Sym", "Last", "Size", "ExchangeTimestamp")
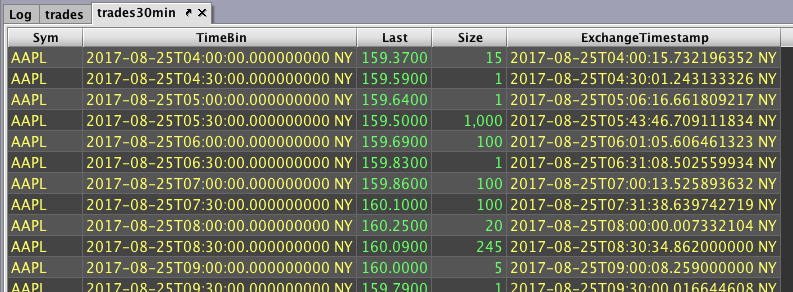
Step 3: Downsample trades to every thirty minutes:
trades30min = trades.updateView("TimeBin=lowerBin(ExchangeTimestamp, 30*MINUTE)")
.firstBy("Sym", "TimeBin")
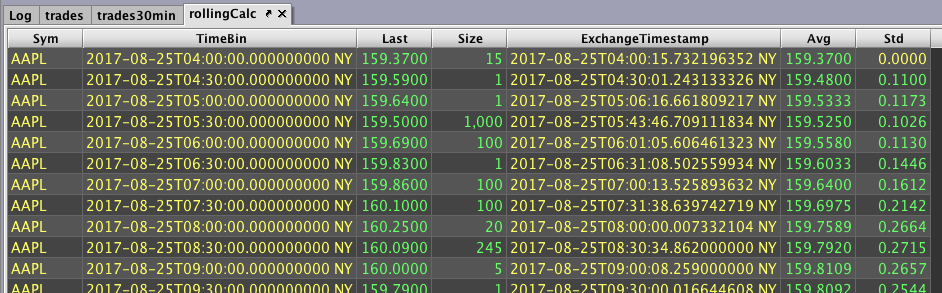
Step 4: Calculate rolling averages and standard deviations:
rollingCalc = trades30min.by("Sym")
.update("Avg=(double[])rollingAvg.call(30, Last)", "Std=(double[])rollingStd.call(30, Last)")
.ungroup()
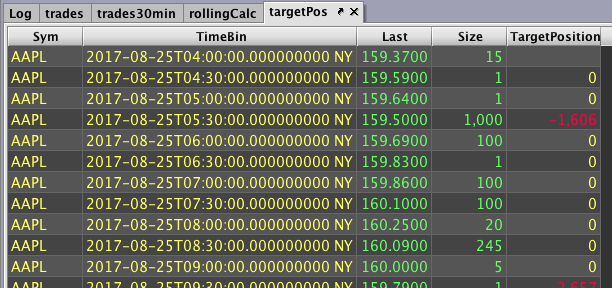
Step 5: Set some constants used to calculate target positions:
minEdge = 0.5d
maxPos = 3.0d
liquidity = 1e6d
Step 6: Calculate target positions:
targetPos = rollingCalc.updateView("Zscore=(Std > 0) ? (Avg-Last)/Std : NULL_DOUBLE", "AdjZscore=signum(Zscore) * min(maxPos, max(abs(Zscore)-minEdge), 0.0)", "TargetPosition=(int)(liquidity*AdjZscore/Last)")
.dropColumns("ExchangeTimestamp", "Avg", "Std", "Zscore", "AdjZscore")
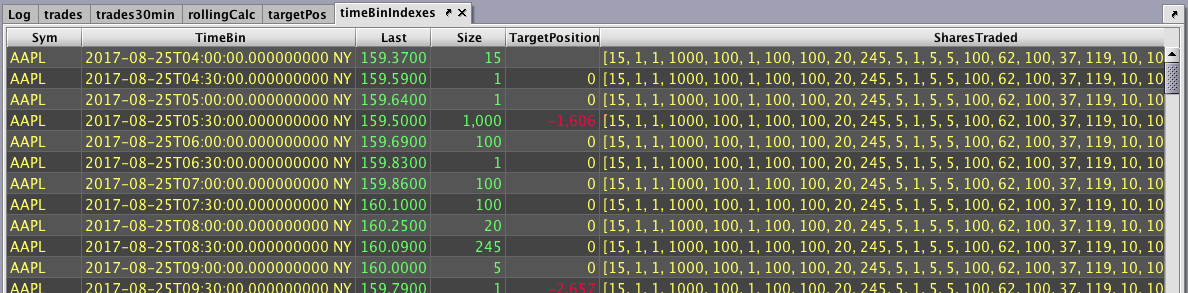
Step 7: Calculate start and end indexes so we can later calculate shares traded every thirty minutes:
timeBinIndexes = targetPos.leftJoin(trades30min, "Sym", "Times=ExchangeTimestamp, SharesTraded=Size")
.updateView("StartIndex=binSearchIndex(Times, TimeBin-30*MINUTE, BS_LOWEST)", "EndIndex=binSearchIndex(Times, TimeBin, BS_HIGHEST)")
.dropColumns("Times")
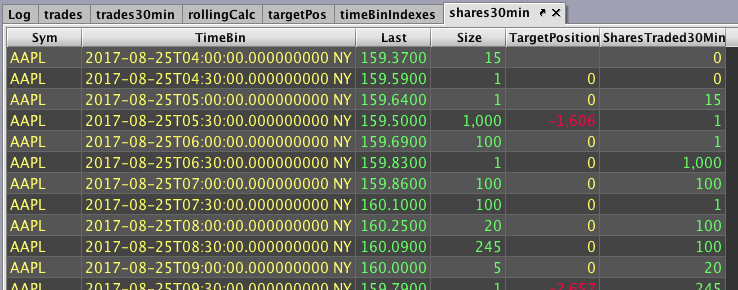
Step 8: Calculate the amount of shares traded every thirty minutes:
shares30min = timeBinIndexes.updateView("SharesTraded30Min=sum(SharesTraded.subArray(StartIndex, EndIndex))")
.dropColumns("SharesTraded", "StartIndex", "EndIndex")
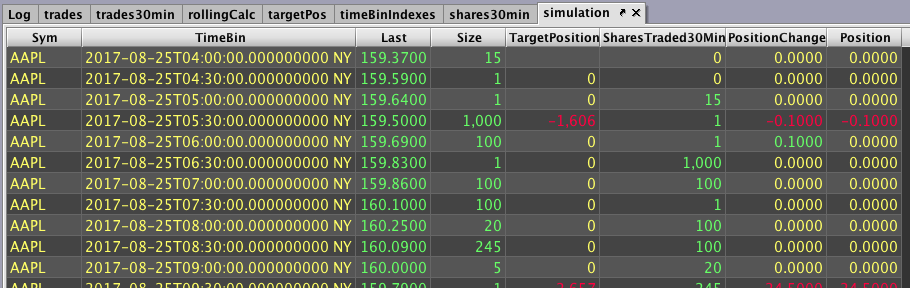
Step 9: Create a class that simulates trade actions and positions for each row of every symbol:
class SimulatorState
{
private HashMap<String, double[]> hm = new HashMap<>()
double[] update(String sym, int targetPos, int shares10s){
if (!hm.containsKey(sym)) hm.put(sym, new double[2])
double[] tradedAndPosition = hm.get(sym)
tradedAndPosition[0] = isNull(targetPos) ? 0.0 : signum(targetPos - tradedAndPosition[1]) * min(abs(targetPos - tradedAndPosition[1]), shares10s * 0.1d)
tradedAndPosition[1] += tradedAndPosition[0]
return Arrays.copyOf(tradedAndPosition, tradedAndPosition.length)
}
}
ss = new SimulatorState()
Step 10: Utilize class to add columns for trade actions and positions:
simulation = shares30min.update("Values=(double[])ss.update(Sym, TargetPosition, SharesTraded30Min)", "PositionChange=Values[0]", "Position=Values[1]")
.dropColumns("Values")
Complete Code Blocks for the Mean Reversion Simulation Recipe
rollingAvg = { rows, values ->
    calculations = new double[values.size()]
    sum = 0
    n = 0

    for (long i = 0; i < values.size(); ++i)
    {
        if (i < rows) n++ //n increments with i until n=rows

        sum += values.get(i) //add each value to sum
        if (i >= rows) sum -= values.get((long)(i - rows)) //subtract when needed

        calculations[(int)i] = sum/n //store running average
    }
    return calculations //return an array of rolling averages
}

rollingStd = { rows, values ->
    // NOTE: variance(X) is most efficiently calculated as E(X^2) - E(X)^2

    calculations = new double[values.size()]
    n = 0
    sum = 0
    sum2 = 0

    for (long i = 0; i < values.size(); ++i)
    {
        if (i > rows) n++ //n increments with i until n=rows
        val = values.get(i)
        sum2 += val*val
        sum += val

    if (i >= rows){
            val = values.get((long)(i - rows))
            sum -= val //subtract when needed
            sum2 -= val*val
    }

        variance = sum2/n - (sum*sum)/(n*n)
        calculations[(int)i] = (variance > 0) ? Math.sqrt(variance): 0 // account for numerical imprecision near 0
    }

    return calculations
}

trades = db.t("LearnDeephaven", "StockTrades")
     .where("Date=`2017-08-25`")
     .view("Sym", "Last", "Size", "ExchangeTimestamp")

trades30min = trades.updateView("TimeBin=lowerBin(ExchangeTimestamp, 30*MINUTE)")
     .firstBy("Sym", "TimeBin")

rollingCalc = trades30min.by("Sym")
      .update("Avg=(double[])rollingAvg.call(30, Last)","Std=(double[])rollingStd.call(30, Last)")
      .ungroup()

minEdge = 0.5d
maxPos = 3.0d
liquidity = 1e6d

targetPos = rollingCalc.updateView("Zscore=(Std > 0) ? (Avg-Last)/Std : NULL_DOUBLE", "AdjZscore=signum(Zscore) * min(maxPos, max(abs(Zscore)-minEdge), 0.0)", "TargetPosition=(int)(liquidity*AdjZscore/Last)")
     .dropColumns("ExchangeTimestamp", "Avg", "Std", "Zscore", "AdjZscore")

timeBinIndexes = targetPos.leftJoin(trades30min, "Sym", "Times=ExchangeTimestamp, SharesTraded=Size")
     .updateView("StartIndex=binSearchIndex(Times, TimeBin-30*MINUTE, BS_LOWEST)", "EndIndex=binSearchIndex(Times, TimeBin, BS_HIGHEST)")
     .dropColumns("Times")

shares30min = timeBinIndexes.updateView("SharesTraded30Min=sum(SharesTraded.subArray(StartIndex, EndIndex))")
     .dropColumns("SharesTraded", "StartIndex", "EndIndex")


class SimulatorState
{
    private HashMap<String, double[]> hm = new HashMap<>()
    double[] update(String sym, int targetPos, int shares10s){
        if (!hm.containsKey(sym)) hm.put(sym, new double[2])

        double[] tradedAndPosition = hm.get(sym)

        tradedAndPosition[0] = isNull(targetPos) ? 0.0 : signum(targetPos - tradedAndPosition[1]) * min(abs(targetPos - tradedAndPosition[1]), shares10s * 0.1d)
        tradedAndPosition[1] += tradedAndPosition[0]

        return Arrays.copyOf(tradedAndPosition, tradedAndPosition.length)
   }
}
ss = new SimulatorState()

simulation = shares30min.update("Values=(double[])ss.update(Sym, TargetPosition, SharesTraded30Min)", "PositionChange=Values[0]", "Position=Values[1]")
      .dropColumns("Values")
# Initial import
from deephaven import *
# Mean Reversion Simulation
def rollingAvg(rows, values):
calculations = jpy.array('double', values.size()) # create an array of doubles
sum = 0
n = 0
for i in range(values.size()):
if i < rows:
n += 1 # n increments with i until n = rows
sum += values.get(i) # add each value to sum
if i >= rows:
sum -= values.get(i - rows) # subtract when needed
avg = sum/n # get updated average every iteration
calculations[i] = avg # store running average
return calculations # return an array of rolling averages
def rollingStd(rows, values):
# Can we use numpy and convolution here instead?
# some other kind of vectorization?
calculations = jpy.array('double', values.size()) # create an array of doubles
sum2 = 0
sum = 0
n = 0
for i in range(values.size()):
if i < rows:
n += 1 # n increments with i until n=rows
val = values.get(i)
sum += val
sum2 += val*val
if i >= rows:
# subtract when needed
val = values.get(i-rows)
sum -= val
sum2 -= val*val
variance = sum2/n - (sum*sum/(n*n))
calculations[i] = variance**0.5 if variance > 0 else 0 # account for numerical precision near 0
return calculations
trades = db.t("LearnDeephaven", "StockTrades")\
.where("Date=`2017-08-25`")\
.view("Sym", "Last", "Size", "ExchangeTimestamp")
trades30min = trades.updateView("TimeBin=lowerBin(ExchangeTimestamp, 30*MINUTE)")\
.firstBy("Sym", "TimeBin")
rollingCalc = trades30min.by("Sym")\
.update("Avg=(double[])rollingAvg.call(30, Last)", "Std=(double[])rollingStd.call(30, Last)")\
.ungroup()
minEdge = 0.5
maxPos = 3.0
liquidity = 1e6
targetPos = rollingCalc.updateView("Zscore= Std > 0 ? (Avg-Last)/Std : NULL_DOUBLE",
"AdjZscore=signum(Zscore) * min(maxPos, max(abs(Zscore)-minEdge), 0.0)",
"TargetPosition=(int)(liquidity*AdjZscore/Last)")\
.dropColumns("ExchangeTimestamp", "Avg", "Std", "Zscore", "AdjZscore")
timeBinIndexes = targetPos.leftJoin(trades30min, "Sym", "Times=ExchangeTimestamp, SharesTraded=Size")\
.updateView("StartIndex=binSearchIndex(Times, TimeBin-30*MINUTE, BS_LOWEST)",
"EndIndex=binSearchIndex(Times, TimeBin, BS_HIGHEST)")\
.dropColumns("Times")
shares30min = timeBinIndexes.updateView("SharesTraded30Min=sum(SharesTraded.subArray(StartIndex, EndIndex))")\
.dropColumns("SharesTraded", "StartIndex", "EndIndex")
from math import copysign
class SimulatorState:
def __init__(self):
self.hm = {}
def __call__(self, sym, targetPos, shares10s):
if sym not in self.hm:
self.hm[sym] = [0.0, ] * 2
tradedAndPosition = self.hm[sym]
tradedAndPosition[0] = 0.0 if (targetPos is None) else copysign(1, targetPos - tradedAndPosition[1]) * min(abs(targetPos - tradedAndPosition[1]), shares10s * 0.1)
tradedAndPosition[1] += tradedAndPosition[0]
return jpy.array('double', list(tradedAndPosition))
ss = SimulatorState()
simulation = shares30min.update("Values=(double[])ss.call(Sym, TargetPosition, SharesTraded30Min)",
"PositionChange=Values[0]", "Position=Values[1]")\
.dropColumns("Values")
Last Updated: 28 February 2020 12:20 -05:00 UTC Deephaven v.1.20200121 (See other versions)
Deephaven Documentation Copyright 2016-2020 Deephaven Data Labs, LLC All Rights Reserved