Basic Capabilities
The following recipes can be found below:
In addition to the code snippets included below, all of the Groovy and Python code for the recipes below can be downloaded as premade Deephaven Notebooks. To learn more about using Deephaven Notebooks, please refer to the Notebook section of the User Manual.
Download the Query Cookbook Notebooks
Tidying Things Up
This recipe shows some of the ways to tidy up, simplify and/or rearrange the table to better suit your own personal preferences. The following methods are demonstrated in this recipe:
dropColumnsviewrenameColumnsmoveColumnsmoveUpColumns
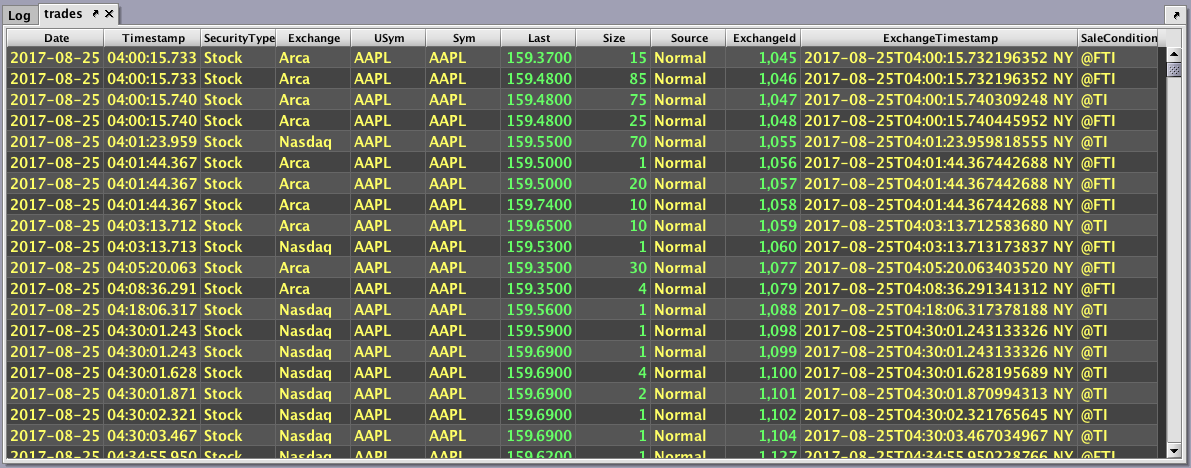
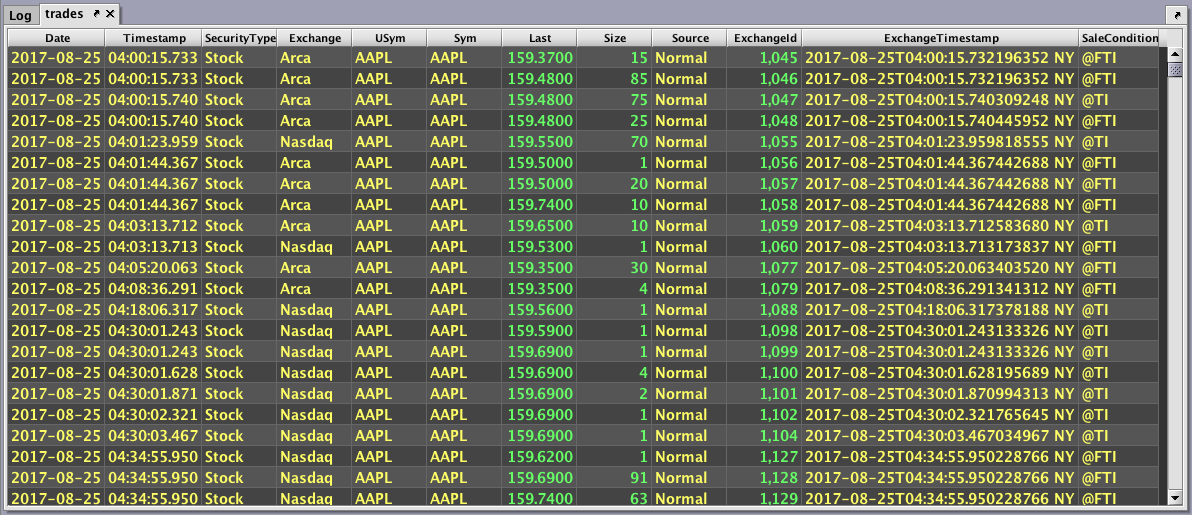
Step 1: Access the namespace and table, and pull trade activity data from a certain date.
trades = db.t("LearnDeephaven", "StockTrades").where("Date=`2017-08-25`")
Step 2: Remove some of the columns to reduce clutter in the interface.
(Note: By eliminating unneeded data, you also increase computing efficiency since there is less data to parse.)
There are two ways to reduce the number of columns being shown:
- You can use the view method to show only specific columns.
- You can use the
dropColumnsmethod to eliminate specific columns.
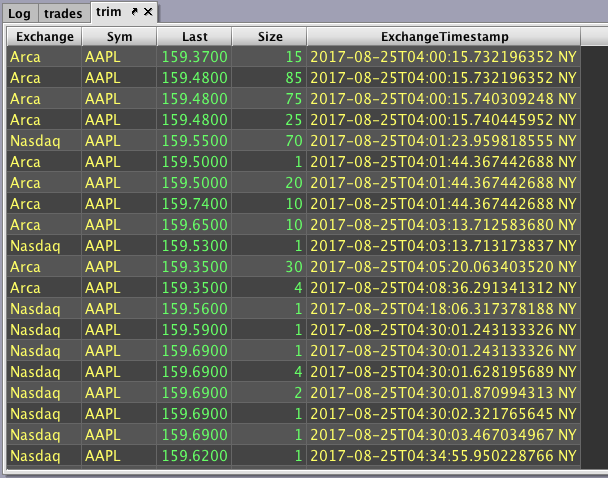
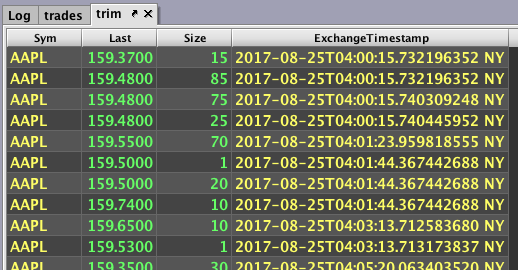
In this example, we want to keep only five of the original 12 columns in the table, so it is more efficient to list the columns we want to keep (using the view method) as shown below:
trim = trades.view("Exchange", "Sym", "Last", "Size", "ExchangeTimestamp")
However, the following query, which lists the seven columns to drop (using the dropColumns method), will result in the same table, which follows:
trim = trades.dropColumns("Date", "Timestamp", "SecurityType", "USym", "Source", "ExchangeId", "SaleCondition")
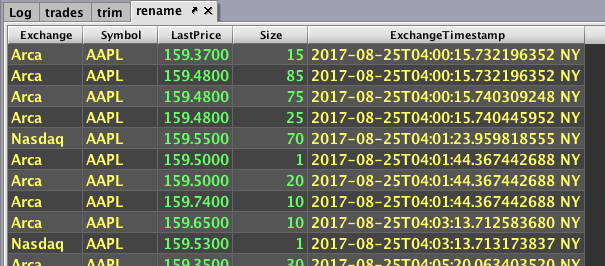
Step 3: Rename columns to be more descriptive.
rename = trim.renameColumns("Symbol=Sym", "LastPrice=Last")
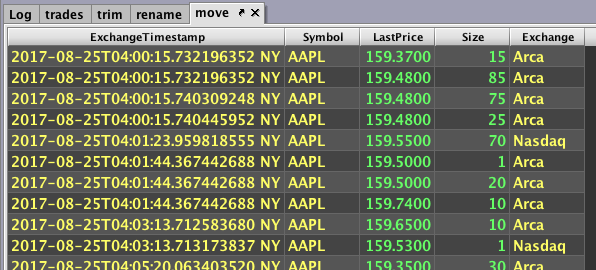
Step 4: Rearrange the column order.
The following query uses the moveColumns method to move the Exchange column to index position 4, and then uses the moveUpColumns method to move the ExchangeTimestamp column to the first position:
move = rename.moveColumns(4, "Exchange").moveUpColumns("ExchangeTimestamp")
Complete Code Blocks for the Tidying Up Recipe
trades = db.t("LearnDeephaven", "StockTrades").where("Date=`2017-08-25`")
trim = trades.view("Exchange", "Sym", "Last", "Size", "ExchangeTimestamp")
rename = trim.renameColumns("Symbol=Sym", "LastPrice=Last")
move = rename.moveColumns(4, "Exchange").moveUpColumns("ExchangeTimestamp")
# Initial import
from deephaven import *
print("Provides:\n"
"\tdeephaven.Calendars as cals\n"
"\tdeephaven.ComboAggregateFactory as caf\n"
"\tdeephaven.DBTimeUtils as dbtu\n"
"\tdeephaven.Plot as plt\n"
"\tdeephaven.Plot.figure_wrapper as figw\n"
"\tdeephaven.QueryScope as qs\n"
"\tdeephaven.TableManagementTools as tmt\n"
"\tdeephaven.TableTools as ttools\n"
"See print(sorted(dir())) for the full namespace contents.")
# Tidying Things Up
trades = db.t("LearnDeephaven", "StockTrades").where("Date=`2017-08-25`")
trim = trades.view("Exchange", "Sym", "Last", "Size", "ExchangeTimestamp")
rename = trim.renameColumns("Symbol=Sym", "LastPrice=Last")
move = rename.moveColumns(4, "Exchange").moveUpColumns("ExchangeTimestamp")
Formatting Tables
This recipe shows some of the ways to format the contents of a table, including numerical formatting and formatting with color. The following methods are demonstrated in this recipe:
formatColumnsformatColumnsWhereformatRowWhereheadheatmap
Step 1: Access the namespace and table, and pull trade activity data from a certain date.
trades = db.t("LearnDeephaven", "StockTrades").where("Date=`2017-08-25`")
Step 2: Remove some of the columns to reduce clutter in the interface.
trim = trades.view("Sym", "Last", "Size", "ExchangeTimestamp")
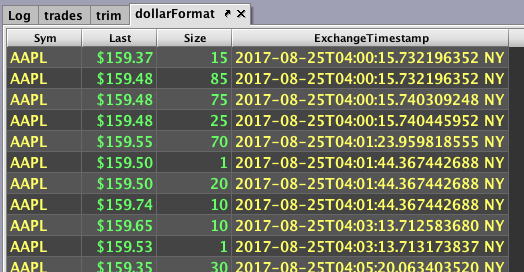
Step 3: Format the Last column so it displays its values numerically with a dollar sign and two decimal places.
dollarFormat = trim.formatColumns("Last=Decimal(`\$0.00`)")
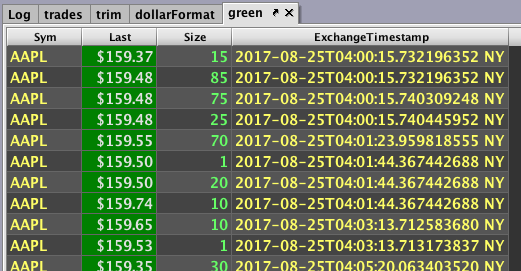
Step 4: Format the background of the Last column with green color.
green = dollarFormat.formatColumns("Last=`GREEN`")
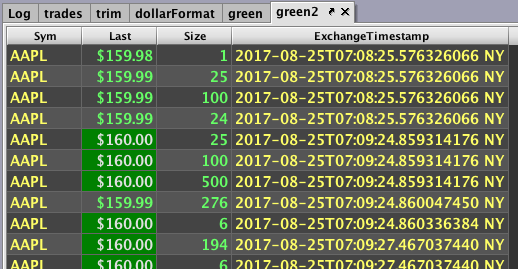
Step 5: Format the background of the Last column with green color only when its value is greater than or equal to 160.
green2 = dollarFormat.formatColumnWhere("Last", "Last >= 160.00", "GREEN")
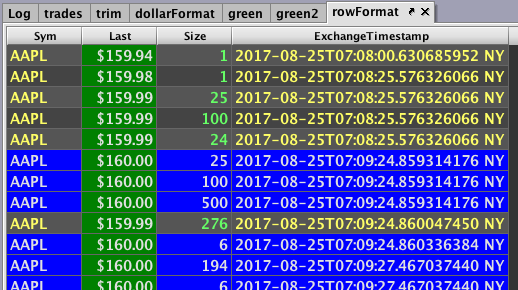
Step 6: Format the background of a row with a blue color when the value in the Last column is greater than or equal to 160.
(Note how column coloring takes priority over row coloring.)
rowFormat = green.formatRowWhere("Last >= 160", "BLUE")
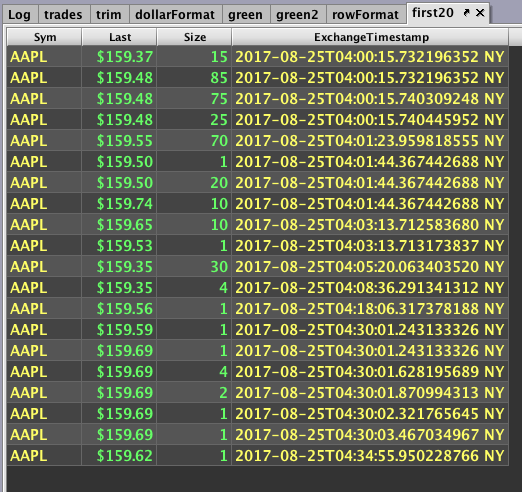
Step 7: Reduce the dollarFormat table so it includes only the first 20 rows.
first20 = dollarFormat.head(20)
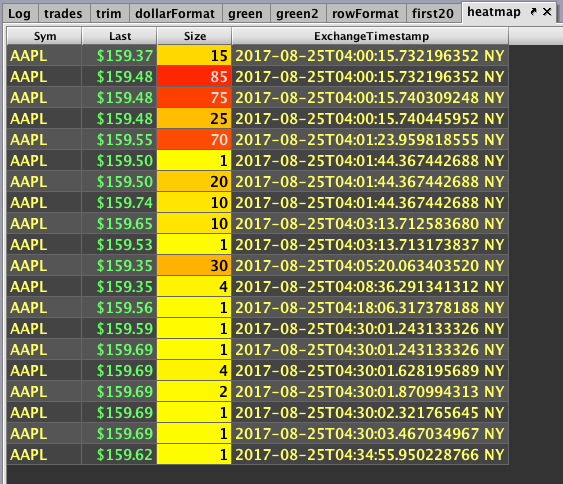
Step 8: Format a column in the table with heatmap coloration.
In this example, the lower values in the Size column will be shown against a yellow background and the higher values will be shown against a red background.
heatmap = first20.formatColumns("Size=heatmap(Size, 0, 100, YELLOW, RED)")
Complete Code Blocks for the Formatting Tables Recipe
trades = db.t("LearnDeephaven", "StockTrades").where("Date=`2017-08-25`")
trim = trades.view("Sym", "Last", "Size", "ExchangeTimestamp")
dollarFormat = trim.formatColumns("Last=Decimal(`\$0.00`)")
green = dollarFormat.formatColumns("Last=`GREEN`")
green2 = dollarFormat.formatColumnWhere("Last", "Last >= 160.00", "GREEN")
rowFormat = green.formatRowWhere("Last >= 160", "BLUE")
first20 = dollarFormat.head(20)
heatmap = first20.formatColumns("Size=heatmap(Size, 0, 100, YELLOW, RED)")
# Formatting Tables
trades = db.t("LearnDeephaven", "StockTrades").where("Date=`2017-08-25`")
trim = trades.view("Sym", "Last", "Size", "ExchangeTimestamp")
dollarFormat = trim.formatColumns("Last=Decimal(`$0.00`)")
green = dollarFormat.formatColumns("Last=`GREEN`")
green2 = dollarFormat.formatColumnWhere("Last", "Last >= 160.00", "GREEN")
rowFormat = green.formatRowWhere("Last >= 160", "BLUE")
first20 = dollarFormat.head(20)
heatmap = first20.formatColumns("Size=heatmap(Size, 0, 100, YELLOW, RED)")
Adding Columns
This recipe demonstrates how to add arbitrary or calculated values to columns in a table. The following methods are demonstrated in this recipe:
updateView
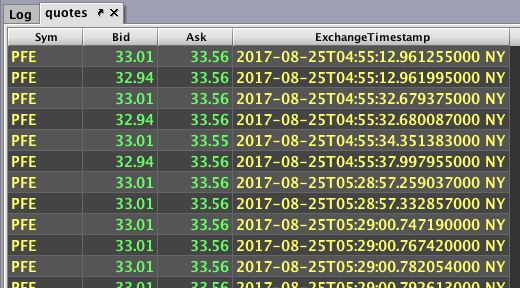
Step 1: Access the namespace and table, pull quote activity data from a certain date, and show only certain columns in the table.
quotes = db.t("LearnDeephaven", StockQuotes")
.where("Date=`2017-08-25`")
.view("Sym", "Bid", "Ask", "ExchangeTimestamp")
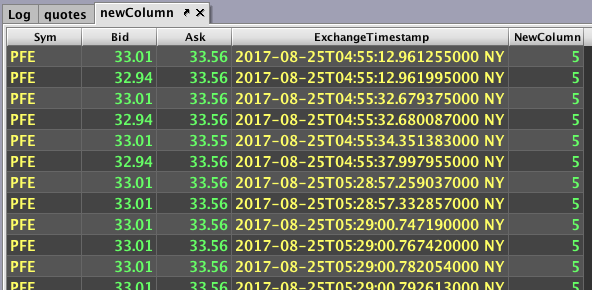
Step 2: Add an arbitrary column to the table.
newColumn = quotes.updateView("NewColumn=5")
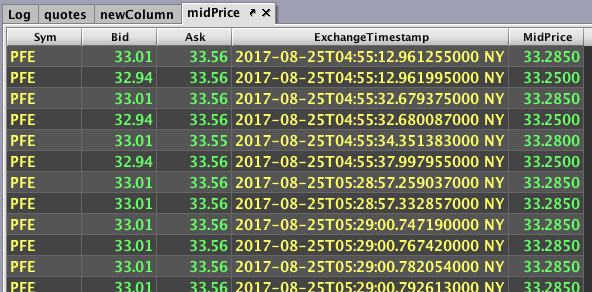
Step 3: Add a column titled MidPrice that calculates the average of the values in the Bid and Ask columns.
midPrice = quotes.updateView("MidPrice=(Bid+Ask)/2")
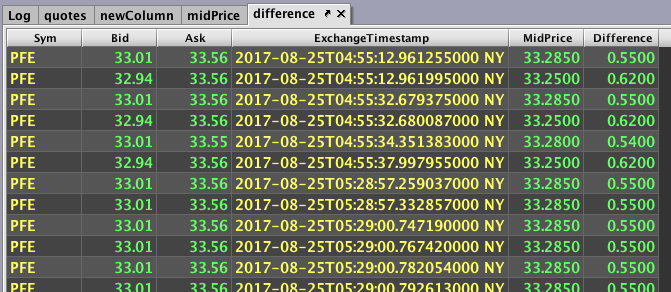
Step 4: Add a column titled Difference, which shows the difference between the values in the Bid and Ask columns.
difference = midPrice.updateView("Difference=abs(Bid-Ask)")
Complete Code Blocks for the Adding Columns Recipe
quotes = db.t("LearnDeephaven", "StockQuotes")
    .where("Date=`2017-08-25`")
    .view("Sym", "Bid", "Ask", "ExchangeTimestamp")
newColumn = quotes.updateView("NewColumn=5")
midPrice = quotes.updateView("MidPrice=(Bid+Ask)/2")
difference = midPrice.updateView("Difference=abs(Bid-Ask)")
# Adding Columns
quotes = db.t("LearnDeephaven", "StockQuotes")\
.where("Date=`2017-08-25`")\
.view("Sym", "Bid", "Ask", "ExchangeTimestamp")
newColumn = quotes.updateView("NewColumn=5")
midPrice = quotes.updateView("MidPrice=(Bid+Ask)/2")
difference = midPrice.updateView("Difference=abs(Bid-Ask)")Table Summaries
This recipe demonstrates how to summarize and/or aggregate the contents of columns in a table. The following methods are demonstrated in this recipe:
sumBylastBybyAddComboAggSumAggLast
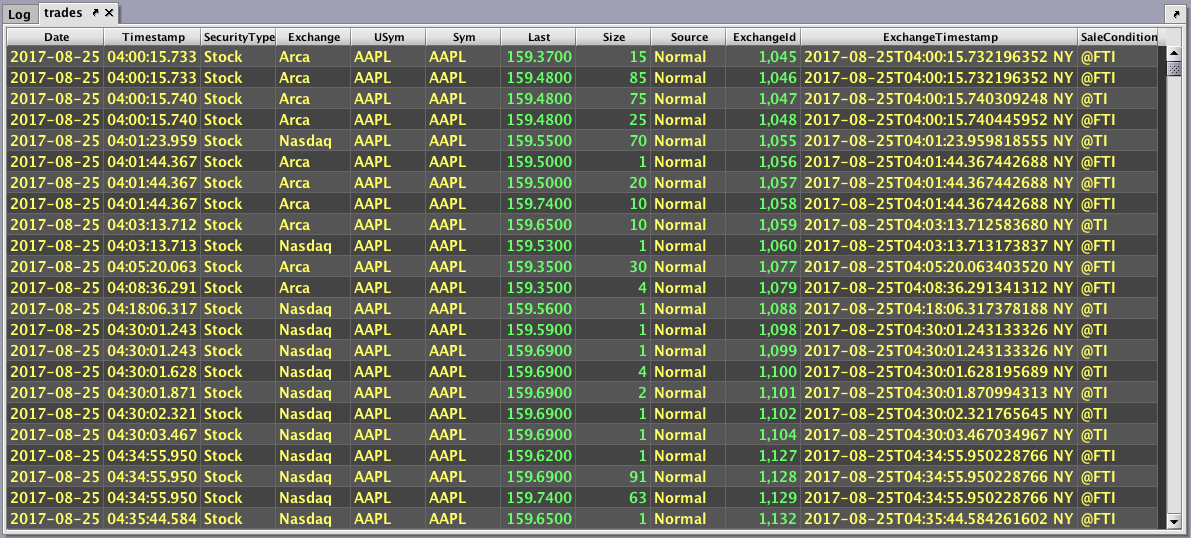
Step 1: Access the namespace and table, and pull trade activity data from a certain date.
trades = db.t("LearnDeephaven", "StockTrades").where("Date=`2017-08-25`")
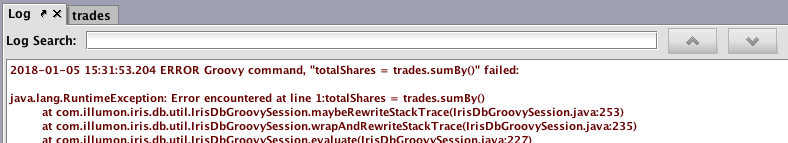
Step 2: Get total number of shares traded for the day.
totalShares = trades.sumBy()
Running this results in an error because the query is attempting to find the sum for every column, including non-number values.
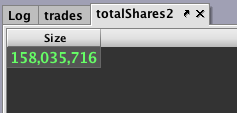
Step 3: This time we will isolate the table to show only the Size column, which contains the values we want to total.
totalShares2 = trades.view("Size").sumBy()
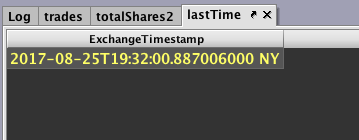
Step 4: Get the timestamp for the last trade of the day.
lastTime = trades.view("ExchangeTimestamp").lastBy()
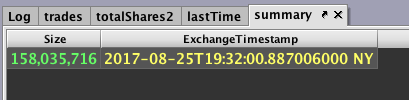
Step 5: Calculate those same aggregations and present them in the same table at the same time.
summary = trades.by(AggCombo(AggSum("Size"), AggLast("ExchangeTimestamp")))
Additional information about using combined aggregations in the query language can be found in the Deephaven documentation.
Complete Code Blocks for the Table Summaries Recipe
trades = db.t("LearnDeephaven", "StockTrades").where("Date=`2017-08-25`")
totalShares2 = trades.view("Size").sumBy()
lastTime = trades.view("ExchangeTimestamp").lastBy()
summary = trades.by(AggCombo(AggSum("Size"), AggLast("ExchangeTimestamp")))
from deephaven import *
trades = db.t("LearnDeephaven", "StockTrades").where("Date=`2017-08-25`")
totalShares2 = trades.view("Size").sumBy()
lastTime = trades.view("ExchangeTimestamp").lastBy()
summary = trades.by(caf.AggCombo(caf.AggSum("Size"), caf.AggLast("ExchangeTimestamp")))
Table Subset Summaries
The following is similar to the previous Table Summaries recipe. However, this recipe demonstrates how to summarize details for each subset of a table rather than the table as a whole. A subset can be thought of as a set of rows that share a specified kind of column value, which in this case will be stock symbols (Sym). The following methods are demonstrated in this recipe:
sumBylastBybyAggComboAggSumAggLast
Step 1: Access the namespace and table, and pull trade activity data from a certain date.
trades = db.t("LearnDeephaven", "StockTrades").where("Date=`2017-08-25`")
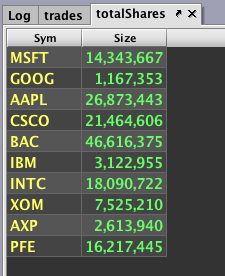
Step 2: Obtain the total number of shares traded for each individual symbol.
(Note that we have to view Sym as well as Size to summarize the table on a symbol-by-symbol basis.)
totalShares = trades.view("Sym", "Size").sumBy("Sym")
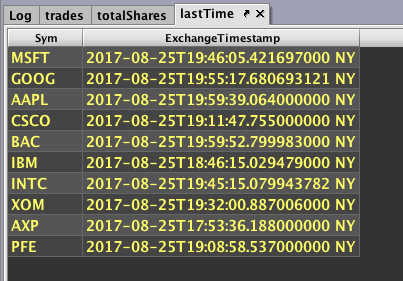
Step 3: Obtain the timestamp for the last time each Sym was traded.
lastTime = trades.view("Sym", "ExchangeTimestamp").lastBy("Sym")
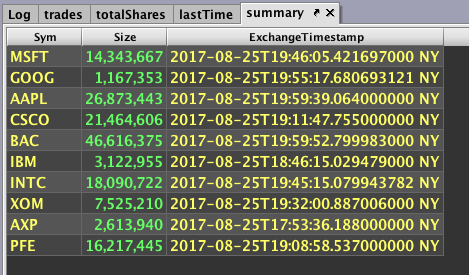
Step 4: Recalculate the summaries in the previous two steps so the results are aggregated into a single table.
(Similar to the view command in Step 2, we must include Sym as an argument along with the aggregation combo to to summarize the table on a symbol-by-symbol basis.)
summary = trades.by(AggCombo(AggSum("Size"), AggLast("ExchangeTimestamp")), "Sym")
Complete Code Blocks for the Table Subset Summaries Recipe
trades = db.t("LearnDeephaven", "StockTrades").where("Date=`2017-08-25`")
totalShares = trades.view("Sym", "Size").sumBy("Sym")
lastTime = trades.view("Sym", "ExchangeTimestamp").lastBy("Sym")
summary = trades.by(AggCombo(AggSum("Size"), AggLast("ExchangeTimestamp")), "Sym")
# Initial import
from deephaven import *
trades = db.t("LearnDeephaven", "StockTrades").where("Date=`2017-08-25`")
totalShares = trades.view("Sym", "Size").sumBy("Sym")
lastTime = trades.view("Sym", "ExchangeTimestamp").lastBy("Sym")
summary = trades.by(caf.AggCombo(caf.AggSum("Size"), caf.AggLast("ExchangeTimestamp")), "Sym")Grouping
This recipe demonstrates how to group (and ungroup) values in a table. The following methods are demonstrated in this recipe:
byheadByungroup
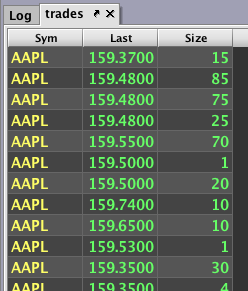
Step 1: Access the namespace and table, pull trade activity data from a certain date, and show only certain columns.
trades = db.t("LearnDeephaven", "StockTrades")
.where("Date=`2017-08-25`")
.view("Sym", "Last", "Size")
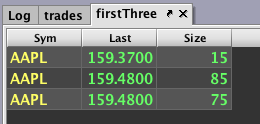
Step 2: For ease in understanding, reduce the table to only the first three rows using the head method.
firstThree = trades.head(3)
Step 3: Group each column into its own cell using the by method.
groups = firstThree.by()
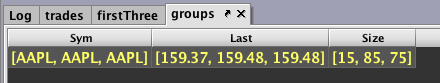
Because there was no argument to the by method, each of the three columns have been grouped into an array of values separated by commas and surrounded by brackets. This example demonstrates the overall grouping process, but is not very practical. We can now start over with something more useful.
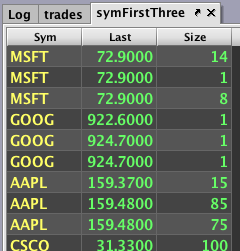
Step 4: Reduce the trades table to show the first three rows of data for each value in the Sym column.
symFirstThree = trades.headBy(3, "Sym")
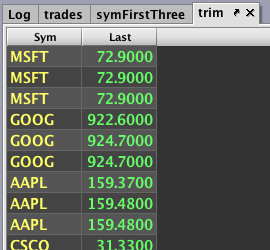
Step 5: Show only the Sym and Last columns.
trim = symFirstThree.view("Sym", "Last")
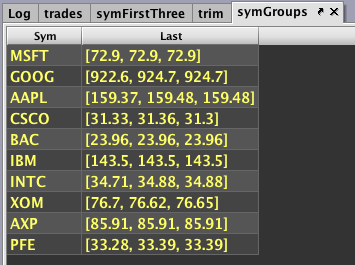
Step 6: Group the data by symbol.
symGroups = trim.by("Sym")
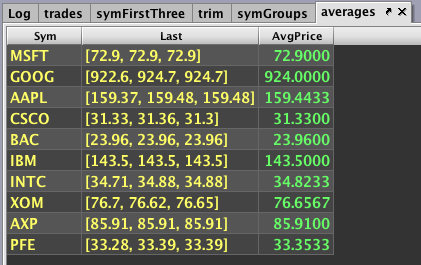
Step 7: Create a new column named AvgPrice to hold the average of the values in the Last column for each symbol using a special group function.
averages = symGroups.updateView("AvgPrice=avg(Last)")
Step 8: The difference between group calculation and a table aggregation is that now we have the option to distribute each value within a group as a row.
ungroup = averages.ungroup()
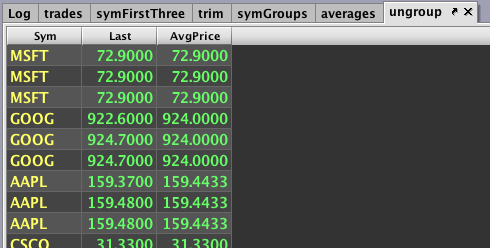
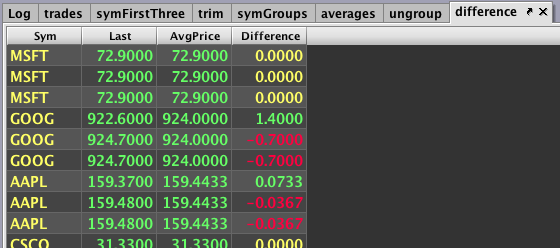
The resulting ungroup table is now the same as the one shown in Step 6, except each row now also has a column that presents the average price for that particular symbol.
Step 9: Create a new column named Difference to hold the calculated difference between the values in the Last and AvgPrice columns for each row.
difference = ungroup.updateView("Difference=AvgPrice-Last")
Complete Code Blocks for the Grouping Recipe
trades = db.t("LearnDeephaven", "StockTrades")
    .where("Date=`2017-08-25`")
    .view("Sym", "Last", "Size", "ExchangeTimestamp")
firstThree = trades.head(3)
groups = firstThree.by()
symFirstThree = trades.headBy(3, "Sym")
trim = symFirstThree.view("Sym", "Last")
symGroups = trim.by("Sym")
averages = symGroups.updateView("AvgPrice=avg(Last)")
ungroup = averages.ungroup()
difference = ungroup.updateView("Difference=AvgPrice-Last")
trades = db.t("LearnDeephaven", "StockTrades")\
.where("Date=`2017-08-25`")\
.view("Sym", "Last", "Size", "ExchangeTimestamp")
firstThree = trades.head(3)
groups = firstThree.by()
symFirstThree = trades.headBy(3, "Sym")
trim = symFirstThree.view("Sym", "Last")
symGroups = trim.by("Sym")
averages = symGroups.updateView("AvgPrice=avg(Last)")
ungroup = averages.ungroup()
difference = ungroup.updateView("Difference=AvgPrice-Last")
Last Updated: 28 February 2020 12:20 -05:00 UTC Deephaven v.1.20200121 (See other versions)
Deephaven Documentation Copyright 2016-2020 Deephaven Data Labs, LLC All Rights Reserved