Create Roll-up Tables
Overview
Roll-up Tables allow users to reduce a large, detailed data set to show only certain, customized aggregated column values. Similar to pivot tables, Roll-up Tables provide the option to group your data by a specified "Group By" column, and then display total values (such as sum or average) of other columns in the tables for those distinct items in the "Group By" column. In other words, if you select Sym as your "Group By" column, and then select the AskSize and BidSize columns to be aggregated as an average, your original table will reload into an expandable table with three columns showing the average AskSize and BidSize for each distinct Sym in the the dataset.
Once created, Roll-up Tables can also be sorted or filtered to extract further insights.
Creating Roll-up Tables can be accomplished through the query language or in the Deephaven console using the Create Roll-up option in the right-click table data menu.
The following section details how to create a Roll-up Table in a Deephaven console. See: Configuring Roll-up Tables through a Query for more about using query methods.
Create Roll-up
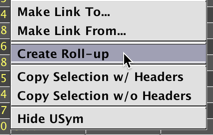
You can create a Roll-up Table from any table in Deephaven. Right-click anywhere within the table data and select Create Roll-up.
When selected, the Create Roll-up dialog window will present options that can be used to group and aggregate the data in different and multiple ways. The following screenshot below demonstrates the options available when the Create Roll-up feature is activated using the StockQuotes table in the LearnDeephaven namespace:
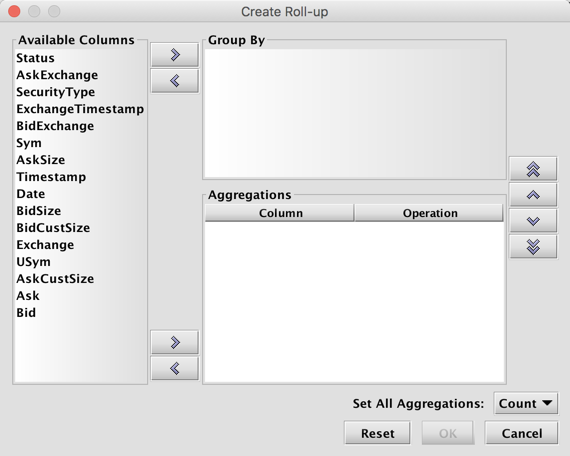
The left side of the Create Roll-up dialog window shows the available columns in the table, while the right side is used to select the column(s) by which to group the table data and the different aggregation methods that may be applied to the remaining columns.
First, select one or more columns from the Available Columns list on the left and then click the button with the right-facing arrow at the top of the panel to move to the Group By field at the right of the window. Next, select one or more of the remaining Available Columns to the Aggregations section by clicking the button with the right-facing arrow at the bottom of the panel. Only the columns that you move to this list will appear in the Roll-up Table.
Note: You can also drag and drop any item into or out from the sections at the right of the window.
Setting Aggregations
When you have moved a column from the Available Columns list to the Aggregations field, you can assign a particular aggregation operation to perform on that column. This is accomplished using the drop-down menu that opens when you click the value listed for that column name under Operation.
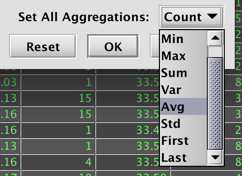
The default operation for all aggregations is Count. The Set All Aggregations drop-down allows you to choose an operation to apply to all of the columns included in the Aggregations field. For instance, you can choose "Avg" as the operation for all columns. If columns in your Aggregations List cannot be averaged, the Operation will automatically revert to Count.
You can also set each aggregation operation manually using the drop-down menu that appears when you click on a row in the Operation column.
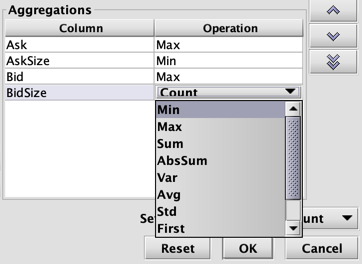
The Operation column will only display aggregations that are meaningful for the data type found in that column. For example, if you select columns with numeric data such as Ask or Bid, operations will include any aggregations that are meaningful for numerical data, including calculations for sum, average, standard deviation, and more. However, if you select text-based columns such as USym or Exchange, you can only choose to count the rows, show the First/Last item in the column, or show the Min (alphabetically first)/Max (alphabetically last) item in the column.
Note: while you cannot use a column again once it is added to the Group By field, you can assign different aggregation operations to the same column.
The column names and values shown in the Group By or Aggregations sections of the table can be reordered as desired. To do so, select the column you want to reorder. Then select from the buttons available on the right side of the dialog window, as shown below:
|
|
Moves the selected column to the top of the order. |
|
|
Moves the selected column up one position. |
|
|
Moves the selected column down one position. |
|
|
Moves the selected column to the bottom of the order. |


Note: the Group By column(s) will always load to the front of the table, and the Aggregations column(s) will follow in the order selected.
To remove a specific column from the Group By or Aggregations fields, first select the column name from the right side of the window and then click the button with left-facing arrow  . The Reset button removes all the columns from both lists.
Consider the following example:
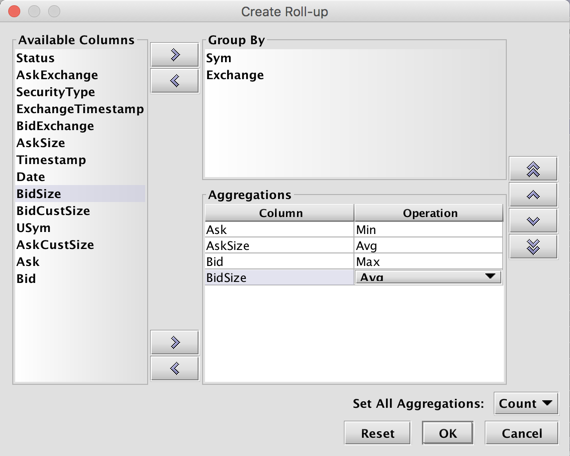
In the screenshot above, the Group By columns are set to Sym and Exchange. So, the Roll-up Table will be grouped first by Sym, then Exchange. Even though, the Set All Aggregations field is set to Count, individual methods have been set for each column in the Aggregations field: the minimum Ask price, the average Ask Size, the maximum Bid price, and average Bid Size.
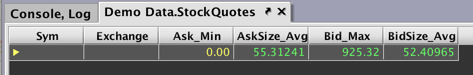
When OK is clicked, the original table reloads as a Roll-up Table. Its initial collapsed state is shown below. The column names include the aggregation being applied in that column.
Clicking the right-facing arrow ( ) in a root row opens the different levels of the Roll-up Table. Once a row is opened, its arrow faces downward (
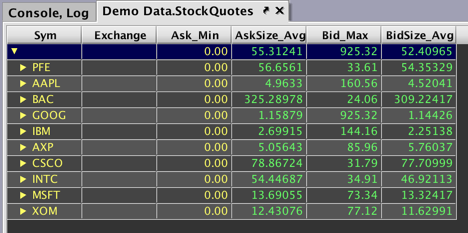
 ). The image below shows the Roll-up Table opened to the first level of distinct
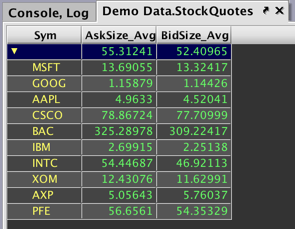
 Sym values. The other four columns in the table (Ask_Min, AskSize_Avg, Bid_Max, and BidSize_Avg) show the selected aggregations for each of the ten distinct Symbols.
Clicking the arrow next to AAPL will then reveal all of the rows for AAPL grouped by the unique values found in the Exchange column, as shown below. The values in each of the other four columns (Ask_Min, AskSize_Avg, Bid_Max, and BidSize_Avg) are aggregated accordingly.
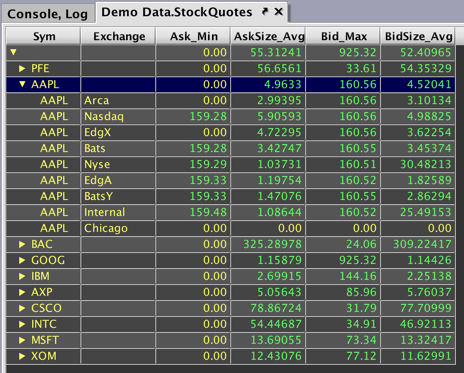
The aggregated values for all AAPL data (without regard to the Exchange) remains visible in the first row. However, the aggregated values for AAPL at each Exchange are also now included in the table. Rows can be re-collapsed by clicking the downward arrow.
So, in a nutshell, this Roll-up Table enables you to quickly review the minimum and maximum Ask and Bid values and the average Ask and Bid sizes for any specific Symbol traded on any specific Exchange...all at a glance.
As with any other tables created in Deephaven, the columns in the Roll-up Table can also be sorted, moved, or hidden. AutoFilters applied to columns in the open table in the UI will carry over to the Roll-up Table.
Note: Only Group By columns may be filtered in a Roll-up Table at this time.
Edit Roll-up Parameters
You can edit your Roll-up Table by selecting Edit Roll-up from the right-click table data menu:
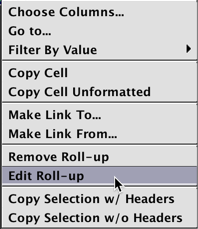
This will open the same dialog window used earlier to create the Roll-up Table. Simply make the required changes to your configuration and select OK.
Remove Roll-up from a Table
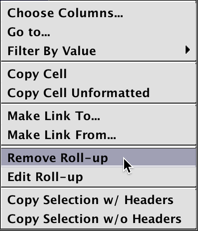
You can revert to your original table by selecting Remove Roll-up from the right-click table data menu:
Reapply Roll-up
You can restore a Roll-up table after it has been removed from the right-click table data menu:
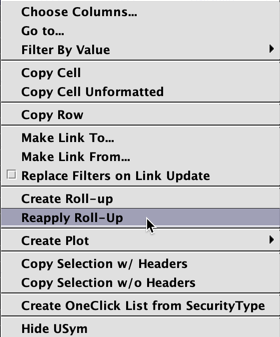
This will reapply your previous Roll-up configuration. However, any sorts or filters applied to the Roll-up table before it was removed will not be restored.
Last Updated: 28 February 2020 12:20 -05:00 UTC Deephaven v.1.20200121 (See other versions)
Deephaven Documentation Copyright 2016-2020 Deephaven Data Labs, LLC All Rights Reserved