Working With Tables
Once a table has been created by a query, its content and layout can be further manipulated in the Deephaven interface. For example, users can choose to hide or show certain columns, change the column order, resize column widths, filter and/or sort the data in the columns, or add more columns to the table. However, the manipulations performed after the table is generated only impact the presentation of the original table. These alterations do not change the underlying values created by the original query - only what the user is presented in the Deephaven interface. All of the original table, as a whole or in parts, can be reinstated at any time.
Table Names
Each table in Deephaven is identified with a tab that shows the name of the table.
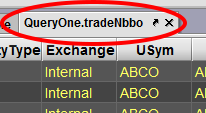
Tables created by persistent queries are automatically named with the name of the query followed by a period, which is then followed with the name of the table used in the query. For example, the graphic below shows the name of a table created by the persistent query named, QueryOne; tradeNbbo is the name of the table.
When you hover the mouse over the tab of a table created by a persistent query, a tooltip will present the query name, the type of table and the name of the table.
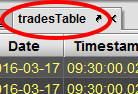
Names of tables created by console-based queries use only the variable used in the query to identify the table. For example, the image below shows the name of a table created by console-based query. tradesTable is the name of the table.
When you hover the mouse over the tab of a table created by a console-based query, a tooltip will present the query name as "Unknown", the type of table (e.g., ConsoleTable) and the name of the table.
Table Statistics
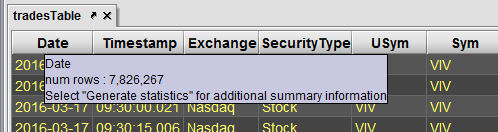
When you hover the mouse over the name of a column, a tooltip will appear and show you the name of the column and the number of rows in that column. It also may present the message,"Select Generate statistics for additional summary information." Generate statistics is a shortcut menu option available when you right-click on a column header.
See also: Generate statistics.
Note: For smaller tables, statistics are generated automatically.
Moving a Column
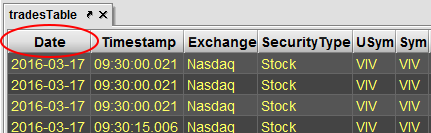
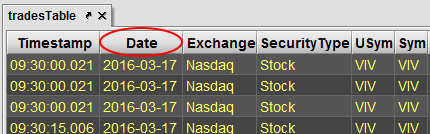
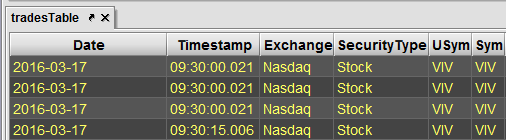
You can move a column left or right by dragging the column header to a new location. In the second image shown below, the Date column was moved to the second position.
Changing Column Width
You can increase or decrease the width of a column by dragging the right border of any column name. For example, the image below now shows an increased width for the Date column.
Note: The minimum width for any column is limited to the width of the cell containing the most characters in that column.
Sorting Data in Columns
You can sort table data in ascending order by clicking once on a column name. To change the sort to descending order, click the column name again. Once a table has been sorted in this fashion, an "up" arrow or "down" arrow will appear to the right of the column name to indicate the sort and the order. See below:
Table with no manually sorted columns.
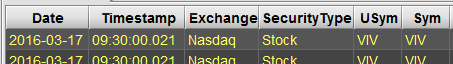
Table showing the Timestamp column has been manually sorted in ascending order.
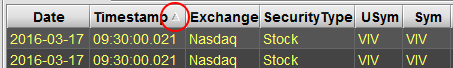
Table showing the Timestamp column has been manually sorted in descending order.
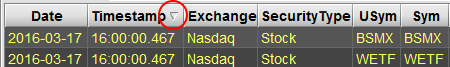
Table Search Bar
Users can add an optional Search Bar to any table in Deephaven. The Search feature quickly filters a table to any value. To access the Search bar, type Ctrl+F or ⌘+F, or select Show Search from the right-click column menu. To learn more, see Show Search.
Go to...
The Go to… feature makes quick work of getting to specific row in the table or jumping to the next row in the table that contains a specific value or string contained in one of the columns.
There are three ways to access the Go to… feature in a Deephaven table:
- Click anywhere in a table, and then press Ctrl+G (Windows) or ⌘+G (macOS).
- Right-click in any of the column headers and select Go to… from the drop-down menu
- Right-click anywhere in the table and select Go to… from the drop-down menu.
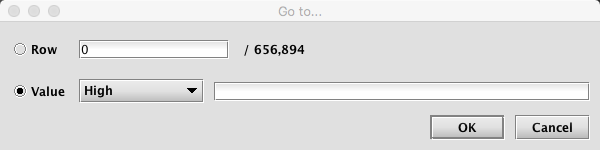
The Go to... dialog windows offer the following options:
When Row is selected, you can enter the number of a specific row to which you want to proceed. (Note: the total number of rows in the table is presented to the right of the Row field.) Click OK or press Enter on your keyboard to go to the selected row.
When Value is selected, you first need to choose the name of the column in which your value will be found. Depending on the column chosen, you may need to select whether the value in that column should be equal to or contain the value entered, and whether it should match the case used in the column. (See images below.) You can then enter the value desired in the last field.
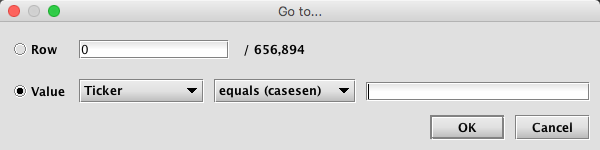
When you click OK or press Enter on your keyboard, you will be taken to the next row in the table that contains that value.
If a table has a timestamp column and you select the name of that column in the Go to… dialog window, the field to the right of the column name will present a "date/time picker". Values in the field can be changed with your mouse/pointer by selecting a value and then using the up/down arrows at the right side of the field to increase or decrease the values. You can also move through the various fields (date, hours, minutes, second, etc.) by using the left or right arrows on your keyboard (or by using Shift+Semicolon combination to scroll right, or the Shift+Ctrl+Semicolon combination to scroll right). The up and down arrows on your keyboard can be used to increase or decrease the values. You can also directly type values into the field.
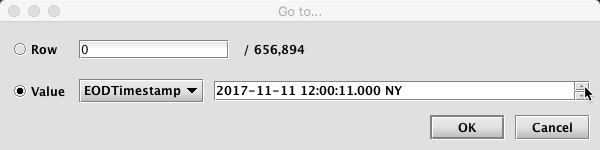
When you click OK or press Enter on your keyboard, you will be taken to the nearest matching timestamp.
Formatting Numeric Data in Columns
Columns containing numerical data can be formatted with several different options. To do so, right-click in the header of the column containing the numerical data and select Format from the drop-down menu.
Columns that contain Double, Float, and BigDecimal data types can be formatted with the following options:
- Default - the default formatting for a column of that type
- Percent - multiplies the column value by 100 and displays the result as a percentage with two decimals; e.g., 0.7550 becomes 75.50%.
- Basis Points - multiplies the column value by 10^4 and displays the result with no decimals and the suffix bp; e.g., 23.7400 becomes 237,400 bp.
- Millions - multiplies the column value by 10^-6 and displays the results with three decimals and the suffix mm; e.g., 201653 becomes 0.202mm.
- Custom - opens the Custom Numeric Format dialog; users can select Decimals (the number of decimal places to show), Exponent (an exponent value by which to multiply the column value, and Suffix (any text value chosen by the user).
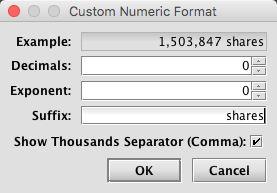
In the example above, the column will display each value with commas and the custom suffix "shares".
Columns that contain Integer, Short, and Long data types can be formatted with the following options:
- Default - see above for description.
- Millions - see above for description.
- Custom - see above for description.
Once a formatting option is selected, it can be saved with the user's workspace by clicking Save in the Console.
Right-Click Shortcuts
After a table has been created by a query, right-click shortcuts are available that can help you manipulate content in the table. For example, users can choose to filter and sort columns, reverse the table, generate statistics and much more.
For more about these options, please refer to: Right-Click Shortcuts.
Last Updated: 23 September 2019 12:17 -04:00 UTC Deephaven v.1.20181212 (See other versions)
Deephaven Documentation Copyright 2016-2019 Deephaven Data Labs, LLC All Rights Reserved