Roll-Up Tables
Overview
Roll-up tables allow users to reduce a large, detailed data set to show only certain, customized aggregated column values. Similar to pivot tables, roll-up tables provide the option to group your data by a specified "Group By" column, and then display total values (such as sum or average) of other columns in the tables for those distinct items in the "Group By" column. In other words, if you select Sym as your "Group By" column, and then select the AskSize and BidSize columns to be aggregated as an average, your original table will reload into an expandable table with three columns showing the average AskSize and BidSize for each distinct Sym in the the dataset.
Once created, roll-up tables can also be sorted or filtered to extract further insights.
Creating roll-up tables can be accomplished through the query language or in the Deephaven console using the Create Roll-up option in the right-click table data menu. To learn more, see: Working With Tables > Create Roll-up Tables. The following section details how to configure Roll-up tables using the query language.
Configuring Roll-up Tables through a Query
Roll-up tables can also be created using the Deephaven query language. The syntax follows:
.rollup(AggCombo([Aggregations...]), groupByColumns...)
Example
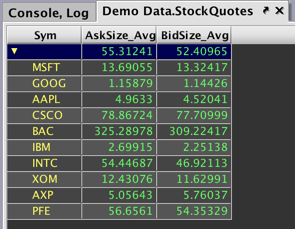
The following example creates a table using data from the StockQuotes table in the LearnIris namespace. The final Roll-up table, t2, will be grouped first by Sym, then Exchange, and show four other columns: the minimum Ask price, the average Ask Size, the maximum Bid price, and average Bid Size.
t1=db.t("LearnIris", "StockQuotes").where()
t2=t1.rollup(AggCombo(AggMin("Ask_Min=Ask"),AggAvg("AskSize_Avg=AskSize"), AggMax("Bid_Max=Bid"), AggAvg("BidSize_Avg=BidSize")), "Sym", "Exchange")
The first line of the query generates the t1 table using data from the StockQuotes table, and fetches all the partitions.
The second line of the query generates the roll-up table, t2, by first applying the .rollup method. It then chains a series of aggregations using the AggCombo method. Be sure to give the new columns in your table unique names; i.e., this query calculates two averages, however, the column names are distinguished as AskSize_Avg and BidSize_Avg. (Using two columns named Avg would cause the query to fail.) Finally, the query specifies the two columns by which to group data.
When the query runs, the t2 table will open in its collapsed state, as shown below.
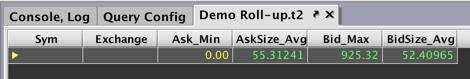
Clicking the right-facing arrow ( ) in a root row opens the different levels of the roll-up table. Once a row is opened, its arrow faces downward (
 ).
).
The image below shows the roll-up table opened to the first level of distinct Sym values. The other four columns in the table (Ask_Min, AskSize_Avg, Bid_Max, and BidSize_Avg) show the selected aggregations for each of the ten distinct Symbols.

Clicking the arrow next to GOOG will then reveal all of the rows for GOOG grouped by the unique values found in the Exchange column, as shown below. The values in each of the other four columns (Ask_Min, AskSize_Avg, Bid_Max, and BidSize_Avg) are aggregated accordingly.
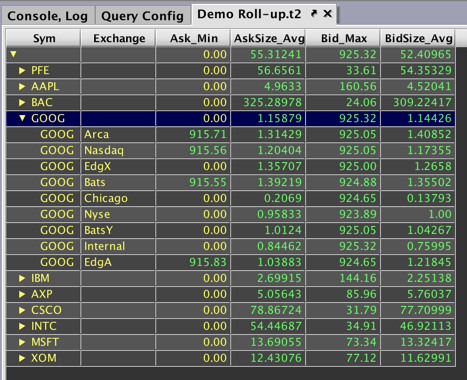
The aggregated values for all GOOG data (without regard to the Exchange) remains visible in the first row. However, the aggregated values for GOOG at each Exchange are also now included in the table. Rows can be re-collapsed by clicking the downward arrow.
As with any other tables created in Deephaven, the columns in the roll-up table can also be sorted, moved, or hidden in the UI. However, any changes to the aggregation parameters must be made in the original query.
Note: Only Group By columns may be filtered in a roll-up table at this time.
Last Updated: 20 August 2019 09:54 -06:00 UTC Deephaven v.1.20180917
Deephaven Documentation Copyright 2016-2018 Deephaven Data Labs, LLC All Rights Reserved